Introduction
Science, Technology, Engineering, and Mathematics (STEM) education prepares students for future careers and drives national economic growth.
In Iowa, STEM jobs are among the fastest-growing, with a projected increase of 22%. However, the governor of Iowa has noted that many companies struggle to find qualified workers with the necessary skills. In response, the state has introduced several initiatives to strengthen STEM education, like the STEM Scale-Up Program , STEM BEST® Program and STEM Teacher Externships Program.
Motivation
Despite the recognized importance of these initiatives, there remains a lack of comprehensive and actionable data on the availability and distribution of STEM resources within Iowa communities.
Additionally, a deeper understanding is needed of the factors influencing students’ decisions to pursue STEM education in Iowa .
Research questions
- Which STEM education resources already exist in Iowa (both those in active use and those that remain untapped)?
- How can these resources be effectively mobilized?
- What benefits would mobilization deliver, and which STEM-education metrics would it improve?
What exactly is STEM ?
Everyone from researchers to employers can define STEM a little differently. Because of that, different US institutions have created their own systems to try and bring consistency to what “counts” as STEM. Some examples we used in our analysis include:
ONET Occupation Codes (OCC) – U.S. Department of Labor
NAICS Codes (North American Industry Classification System) – used by businesses and government agencies (like the U.S. Census Bureau)
CIP Codes (Classification of Instructional Programs) – used by the National Center for Education Statistics
Despite having these codes, there isn’t a standard definition of STEM that works across all datasets. That was one of our key limitations: different sectors use different classification systems, and the data we gathered came from many sources. This means we had to be mindful of how we interpreted “STEM” in each context.
Methodology
Results
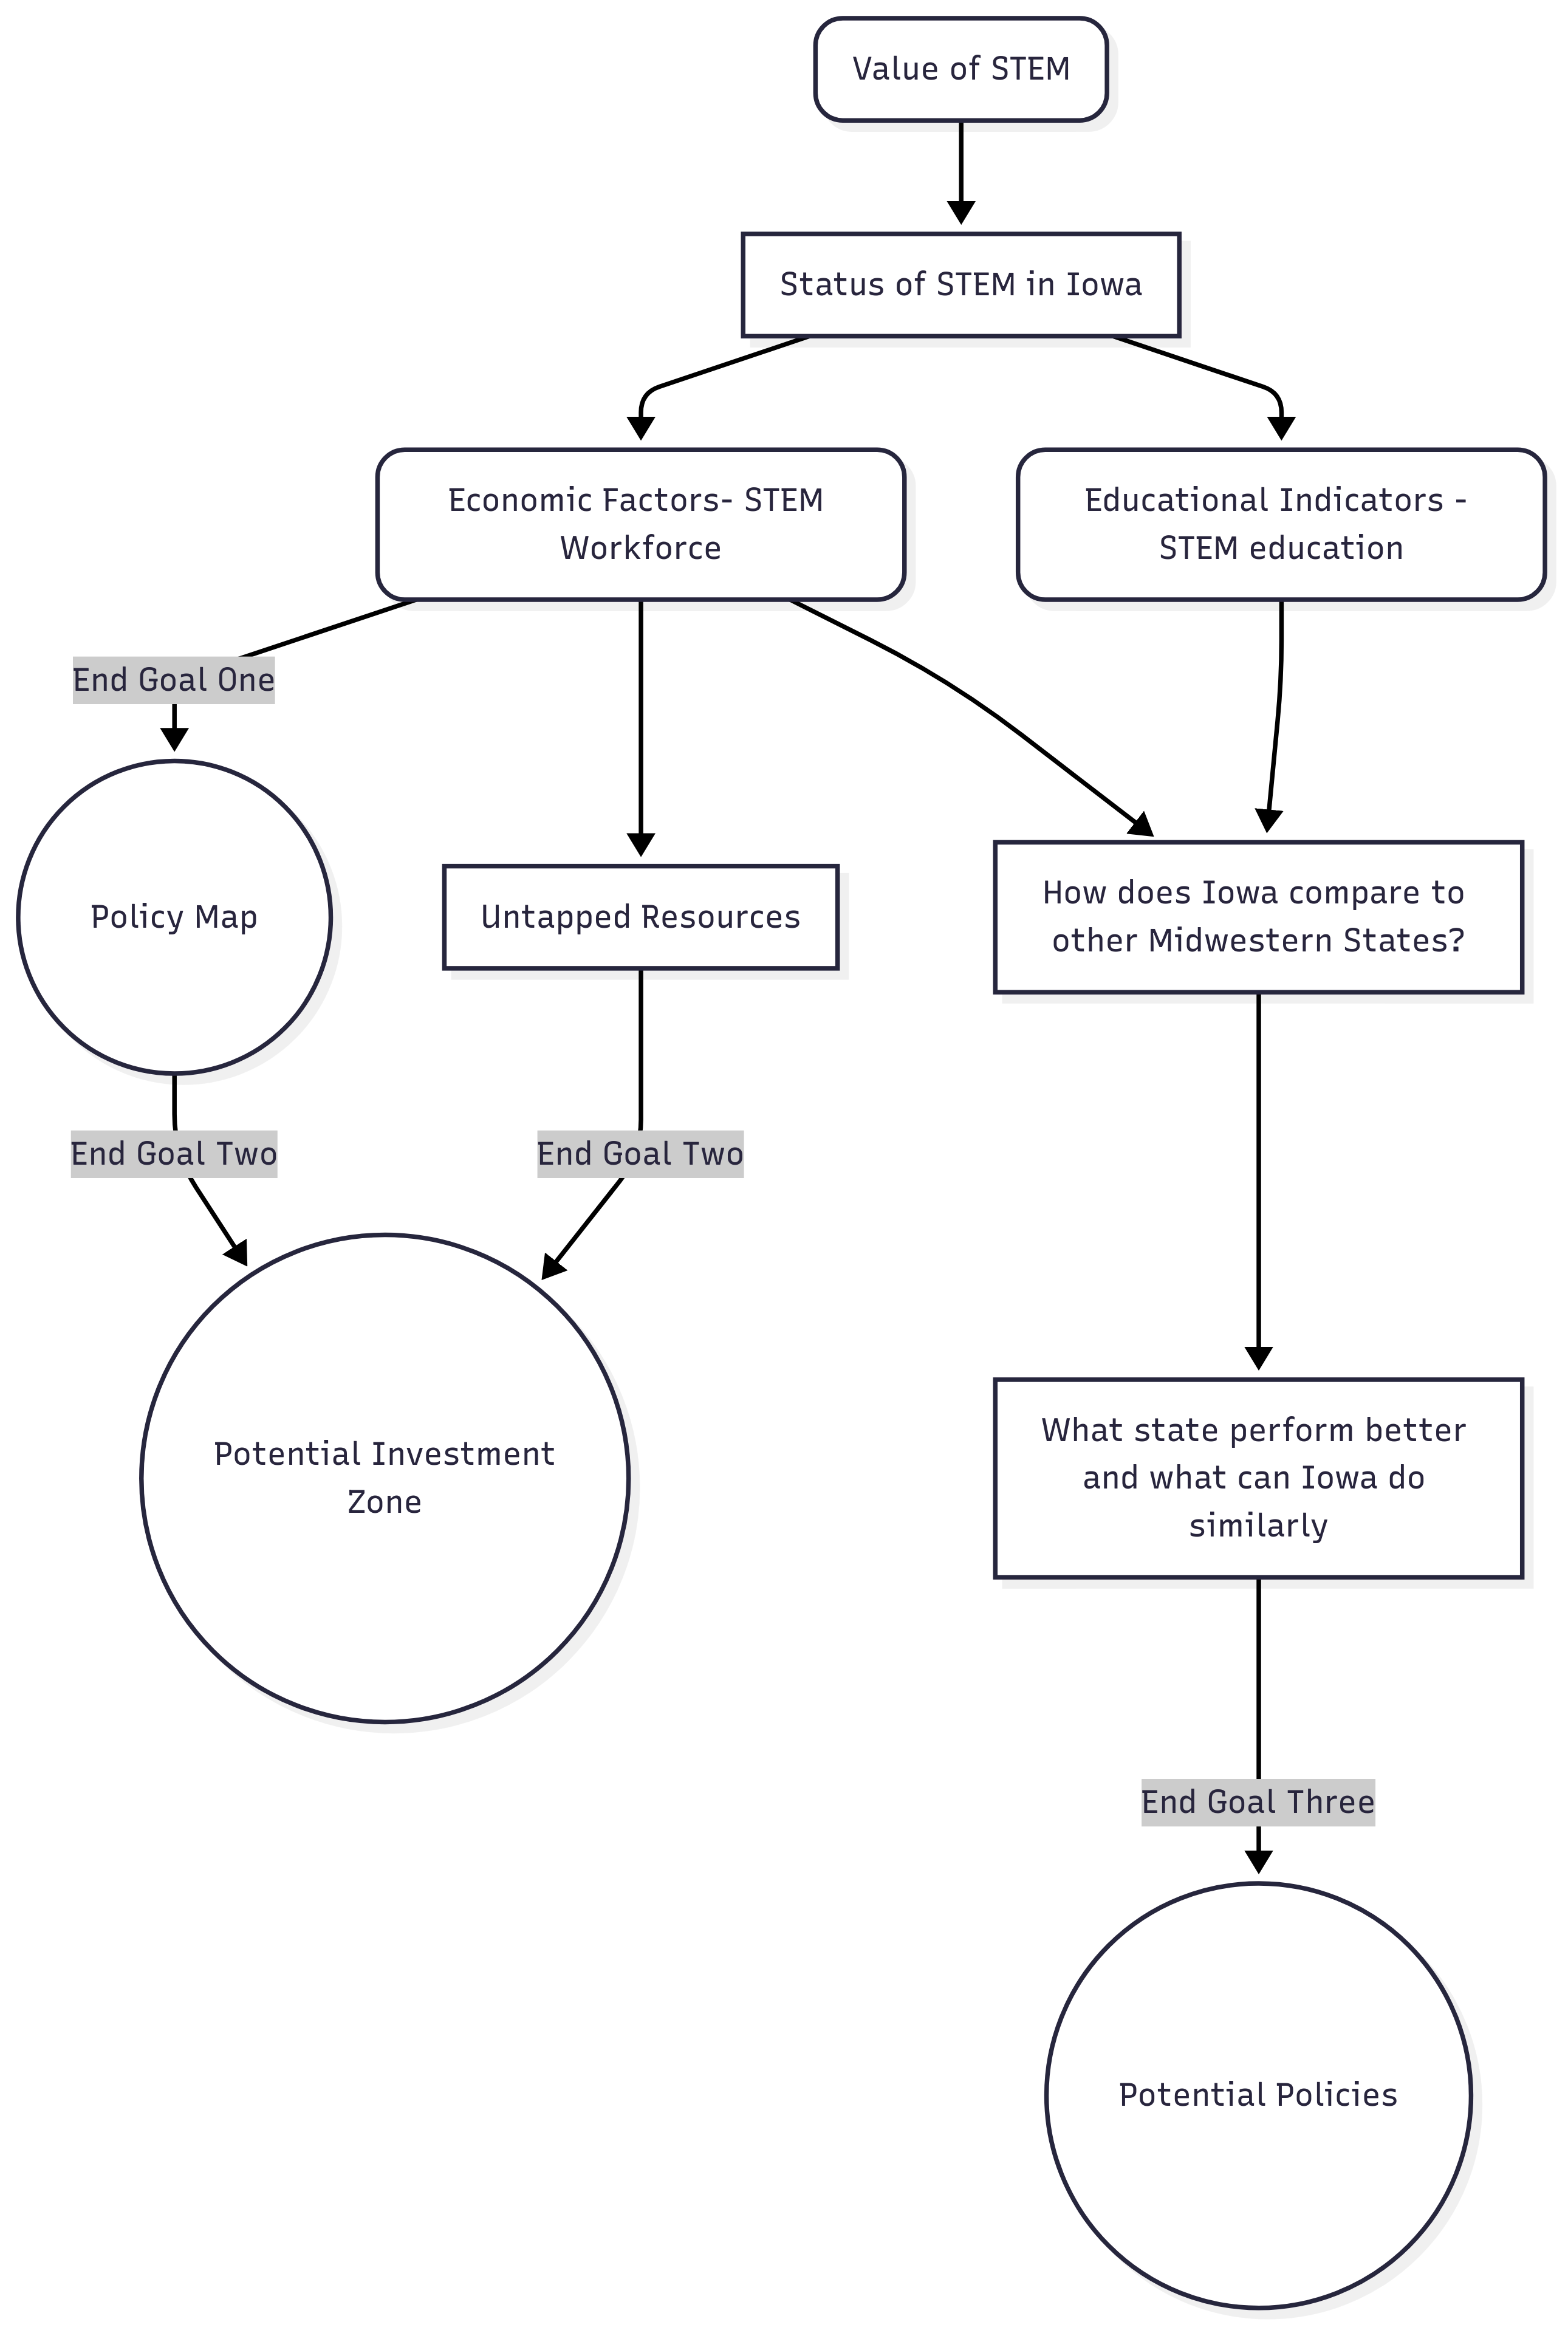
Finding Economic Factors and Educational Indicators
Main Factor: Growth Rate in Businesses

- Used the CAGR metric: \(\text{CAGR} = \left( \frac{V_f}{V_i} \right)^{\frac{1}{n}} - 1\)
- Where:
- \(V_f\) = total establishments in final year
- \(V_i\) = initial establishments in initial year
- n = number of years
- Where:
- Higher significant growth rate in STEM businesses than in non STEM businesses in Iowa
- Since there is a higher growth, this could indicate there’s a potential to investing in STEM in Iowa
Other Factors:
- Job Creation
- Unemployment Rate
- Projected Growth
- Link To Other Factors
Main indicator: Student Interest in STEM
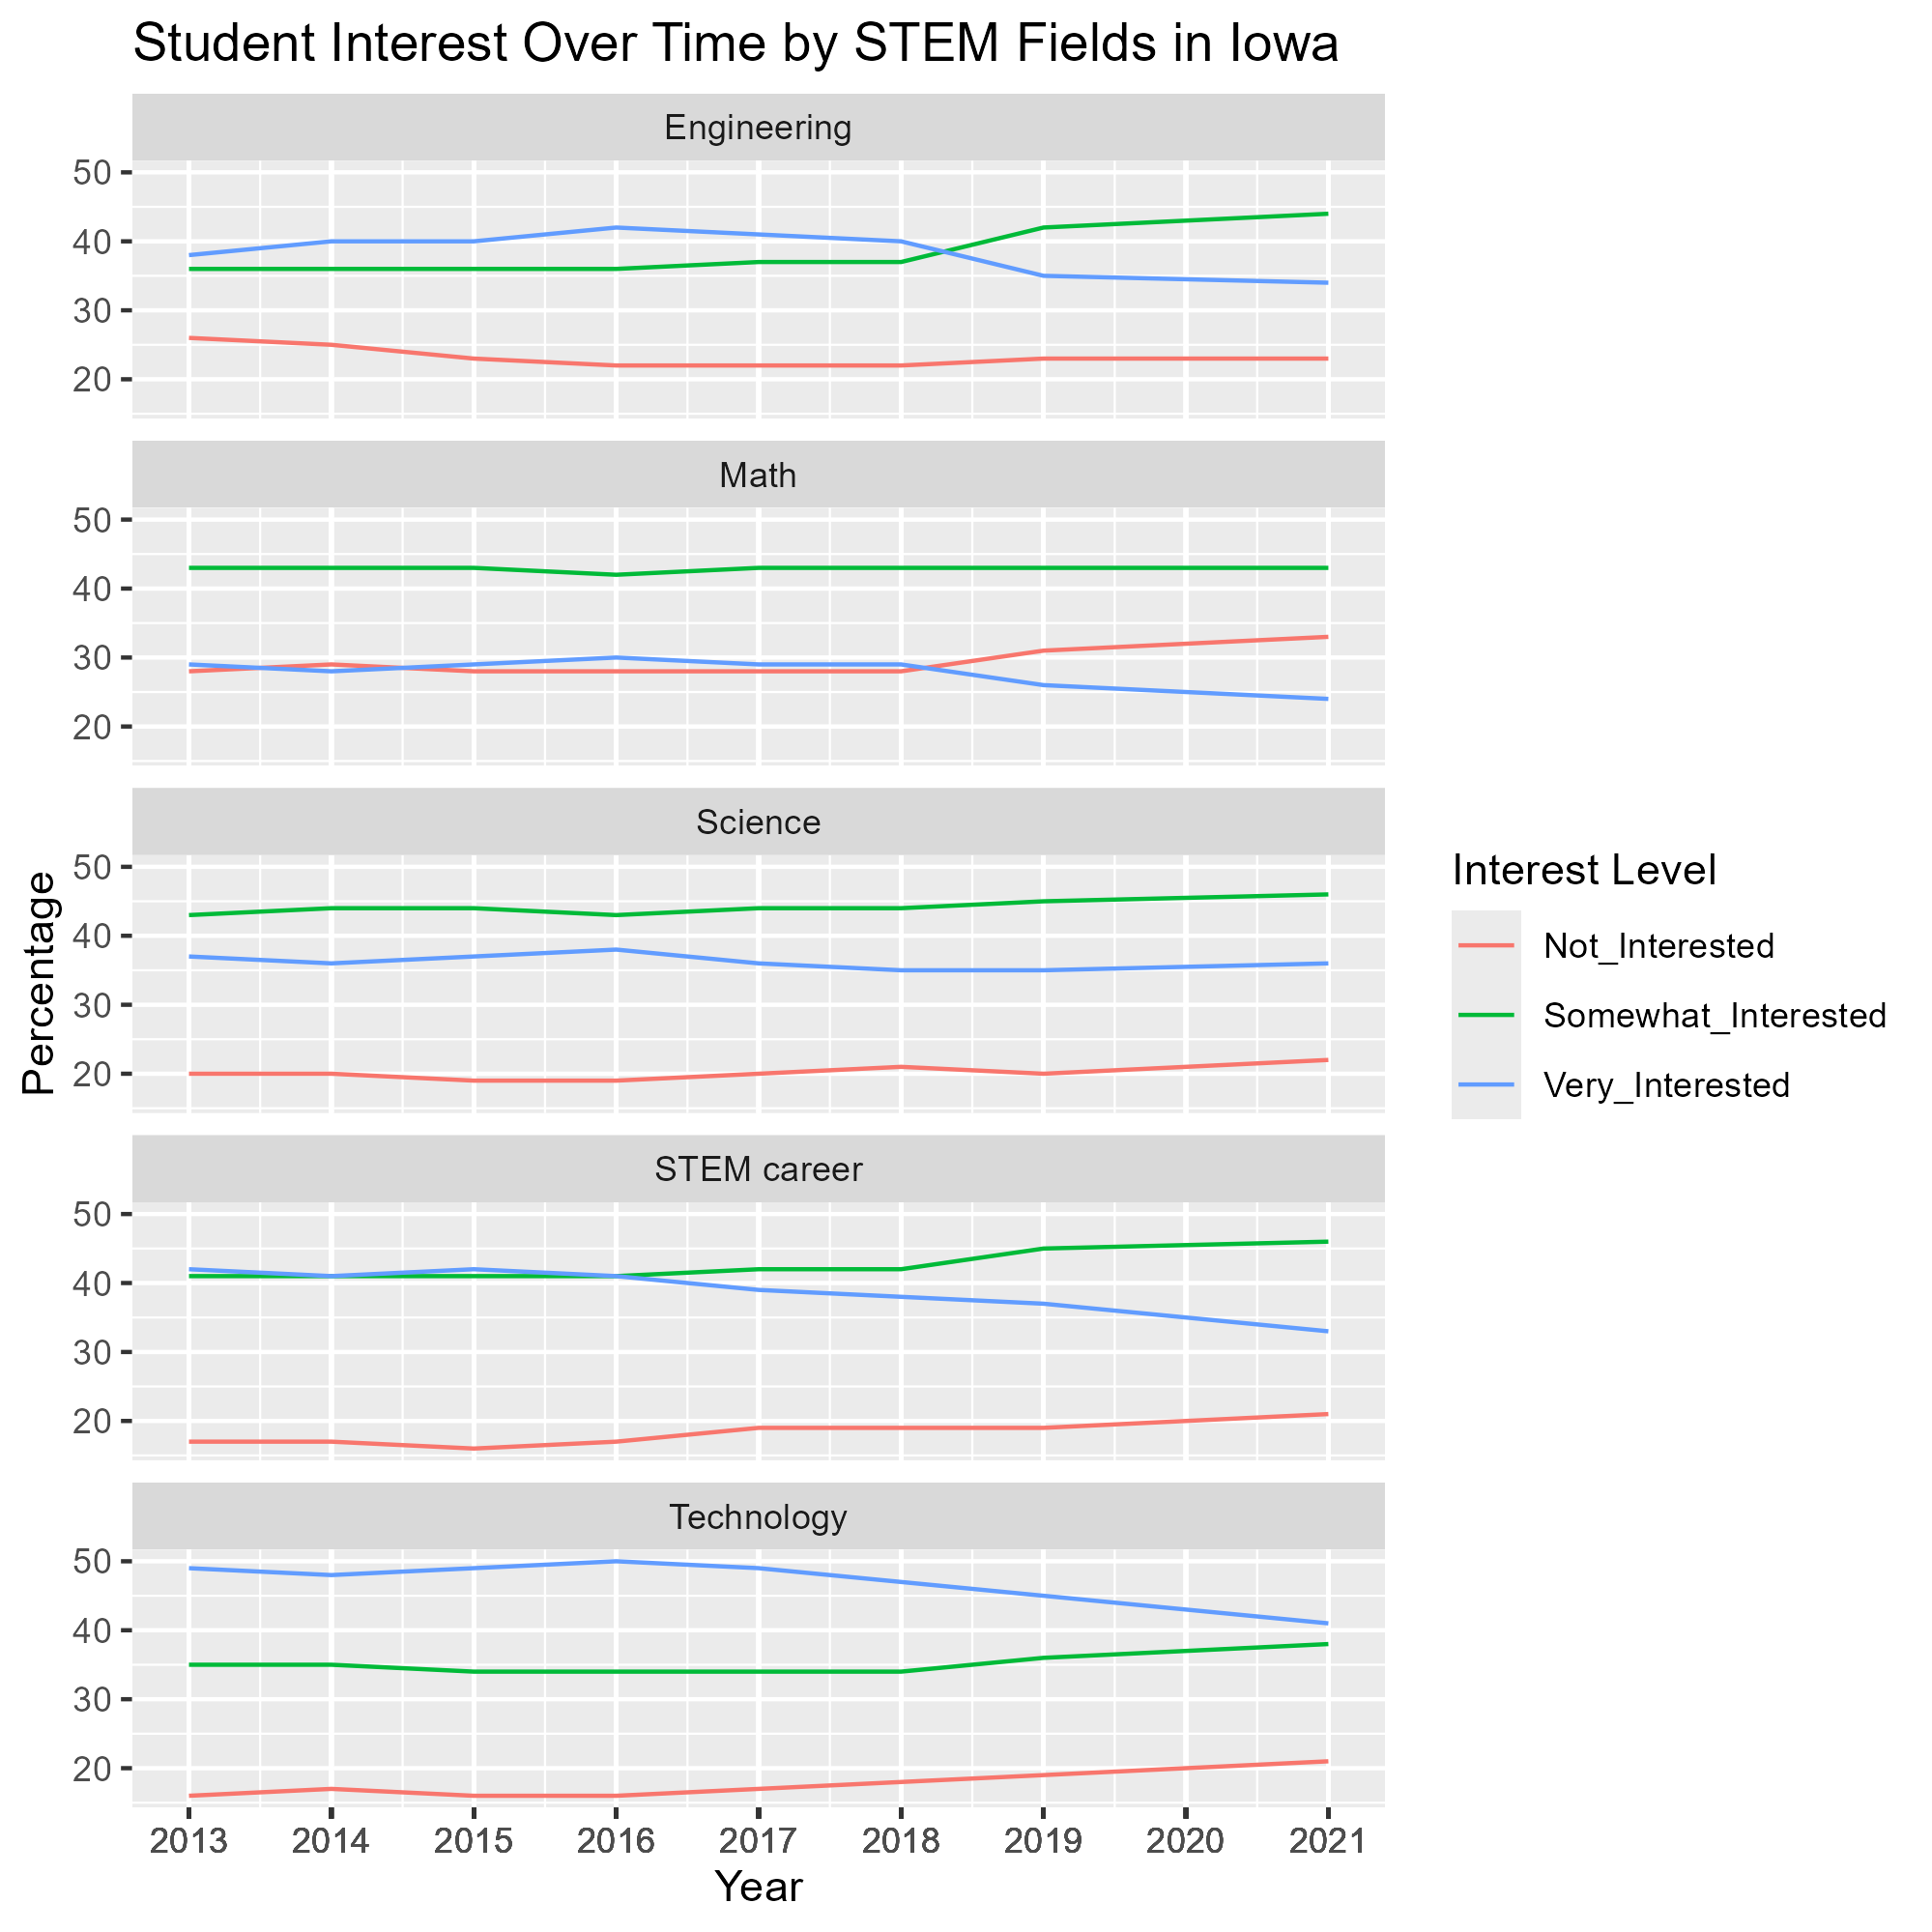
- In every field, the students in the very interested category has decreased
- A large decrease in students very interested in a STEM field
Other Indicators:
- ISASP and NAEP Math scores
- ACT scores
- STEM related courses enrollment in high school
- Link To other Indicators
Differences in factors and indictors between Iowa and the Midwest
Degrees Conferred
According to the NSF, 60% of all STEM workers have a minimum of an assocsiate’s degree. Of S&E workers, 84.3% have at least an associate’s degree (National Science Foundation). Therefore, noting post-secondary education outcomes in Iowa can be valuable for evaluating the potential STEM workforce in Iowa.

Top 3 states:
1. Wisconsin - 38.2%
2. Michigan - 38.1%
3. Iowa - 35.3%
Other differences we found:
- Math Scores
- Job Creation
- Unemployment
- Link to these Differences
Untapped Resources Map
According to previous educational indicator data, Iowa confers the third-highest percentage of STEM degrees in the Midwest, despite lacking a major STEM-focused institution like UIUC in Illinois or UW–Madison in Wisconsin. So why isn’t Iowa more widely recognized as a key player in STEM? One possible hypothesis we considered is that students earn their degrees in Iowa—attracted by lower tuition costs—but then leave the state after graduating. To explore this, we examined migration patterns:

Resource map
Iowa Universities and Colleges by Institution Type
List of institutions gathered from the Iowa Department of Education
We plan to compile this map with the other resources. Seeing locations of post-secondary insitututions, when paired with other resources, can help entice companies to find suitable locations in Iowa for business development.
Next steps
- Policy Map Database: a compilation of GDP, R&D by industry, per state (Bureau of Economic Analysis). Purpose: analyze GDP by industry, R&D intensity
- STEM attrition reduction policies: analysis of policies in the Midwest of states with better STEM indicators
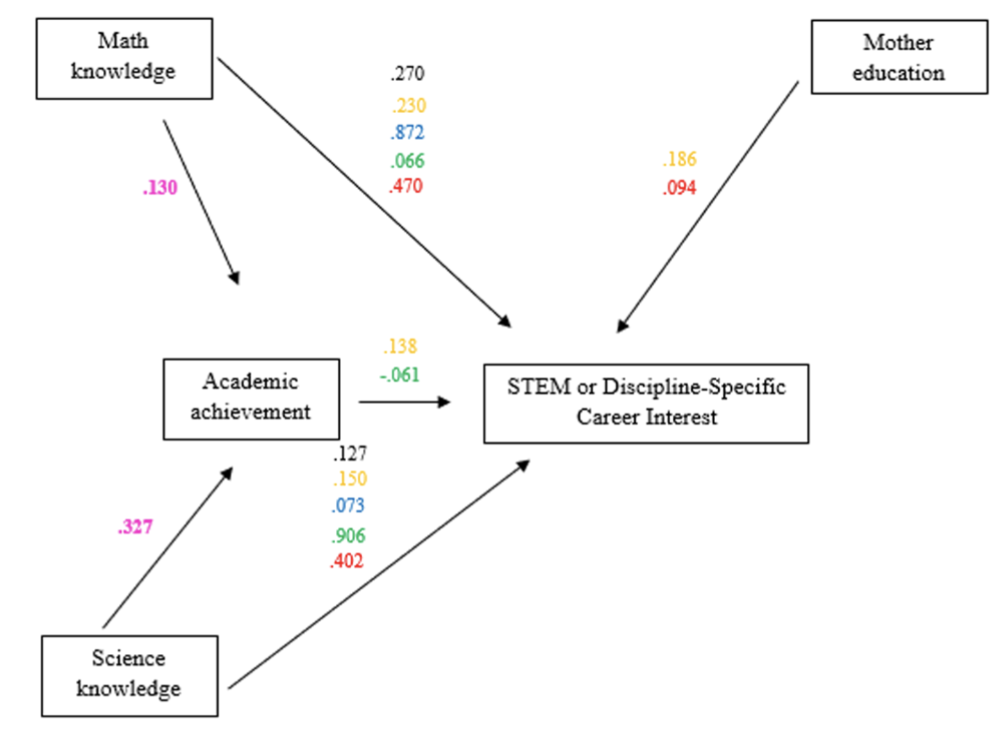
- STEM education influence diagram: a model for Iowa students inspired in the work of Amalina et al. (2025):
Limitations
- ACS (1 year survey data) isn’t available for all the counties of Iowa.
- No standard definition of STEM.
- We don’t have the most recent data for most of the datasets we used. (ex: opportunity zones data last available:2018)
What have we learning so far in DSPG?
- Skills:
- GitHub workflows
- Using Tableau and Leaflet for interactive mapping
- Geocoding using Google API
- Cleaning data using tidyr and dplyr in R
- Knowledge:
- Researching data sources
- Uses of the US Census data
- Understanding how easily public data can be skewed
Resources
- National Center for Educational Statistics (NCES)
- CBP dataset from the Census Bureau
- Iowa Department of Education
- US Census Data (ACS, PUMS)
References
Amalina, I. K., Vidákovich, T., & Karimova, K. (2025). Factors influencing student interest in STEM careers: motivational, cognitive, and socioeconomic status. Humanities and Social Sciences Communications, 12(1), 1-15.