Science, Technology, Engineering, and Mathematics (STEM) education prepares students for future careers and drives national economic growth. It equips students with critical thinking, problem-solving, and technical skills needed in today’s workforce. It plays a central role in fostering innovation, as seen through increased rates of patent filings and startup creation in STEM fields.
In Iowa, STEM jobs are among the fastest-growing, with a projected increase of 22%. However, the governor of Iowa has noted that many companies struggle to find qualified workers with the necessary skills. In response, the state has introduced several initiatives to strengthen STEM education. The STEM Scale-Up Program delivers high-quality materials and professional training to educators across the state. The STEM BEST® Program encourages collaboration between schools and local businesses to provide students with hands-on, real-world learning experiences. The STEM Teacher Externships Program offers teachers opportunities to work in STEM-related industries during the summer, allowing them to integrate practical insights into their classroom instruction.
Despite the recognized importance of these initiatives, there remains a lack of comprehensive and actionable data on the availability and distribution of STEM resources within Iowa communities. It is unclear how extensive these resources are and how effectively they can be mobilized to support STEM education development. Additionally, a deeper understanding is needed of the factors influencing students’ decisions to pursue STEM education in Iowa, such as access to local job opportunities, educational infrastructure, participation in science fairs, and extracurricular programs.
What is STEM?
Several US institutions manage different interpretations of STEM for the academy and industry. The US Census uses the North American Industry Classification System (NAICS) to classify STEM and non-STEM companies. The Bureau of Labor Statistics uses the Standard Occupational Classification (SOC), whereas the Department of Homeland Security uses the Classification of Instructional Programs (CIP) to determine STEM fields. The National Science Foundation defines two STEM classifications: Science and Engineering and Science (life, physical, social scientists, and engineers) and Engineering-related jobs (health, S&E managers, S&E precollege teachers, technologists, and technicians). The US Census data includes SOC and CIP codes, but other data sources only include one classification type.
Initial Research Questions
Which STEM education resources already exist in Iowa (both those in active use and those that remain untapped)?
How can these resources be effectively mobilized?
What benefits would mobilization deliver, and which STEM-education metrics would it improve?
What are the advantages of STEM education?
Growth Rate of STEM vs non-STEM companies
Increased Innovations and Export
Income Potential
Projected Growth
Lower Unemployment Rate
Economic contribution: Growth Rate
To look at how growth rate differs between STEM vs non-STEM companies, we need to ask some questions:
What metric can be used to compare growth rate between businesses? Why is this metric better compared to others?
What are some potential datasets that could be used?
How do you differentiate STEM vs non-STEM companies?
Steps
Aimed to compare growth rates between STEM and non-STEM businesses using the Compound Annual Growth Rate (CAGR) metric
CAGR allows for consistent comparison across time periods and smooths out short-term fluctuations to reveal long-term trends
Used the County Business Patterns (CBP) dataset from the U.S. Census Bureau to find relevant data:
CBP provides annual economic data by industry and state.
Industries are categorized using NAICS codes, which range from 2 to 6 digits in length (longer codes represent more specific fields).
Chose to work with 3-digit NAICS codes, since there are thousands of 4-, 5-, and 6-digit NAICS codes.
Manually classified the 3-digit NAICS codes into STEM and non-STEM categories.
For each state:
Summed the number of establishments in each category for 2017 and 2022
An establishment is
a single physical location where a business conducts operations or provides services
discrete unit of analysis within a business, distinct from the broader company or enterprise
a sector rather than the whole busines
Used these values to calculate CAGR for both STEM and non-STEM sectors.
computed the CAGR difference using the formula: STEM_CAGR - non-STEM_CAGR
Visualized results in Tableau
Economic contribution: Innovations and export
This section breaks into multiple subfactors that contribute to economic impact, including job creation, internet access, exports, wages, and innovation. Each factor provides a lens into how STEM-related activity drives or correlates with regional economic performance.
1. Job Creation in STEM-Related Sectors
Source: Business Dynamics Statistics (BDS)
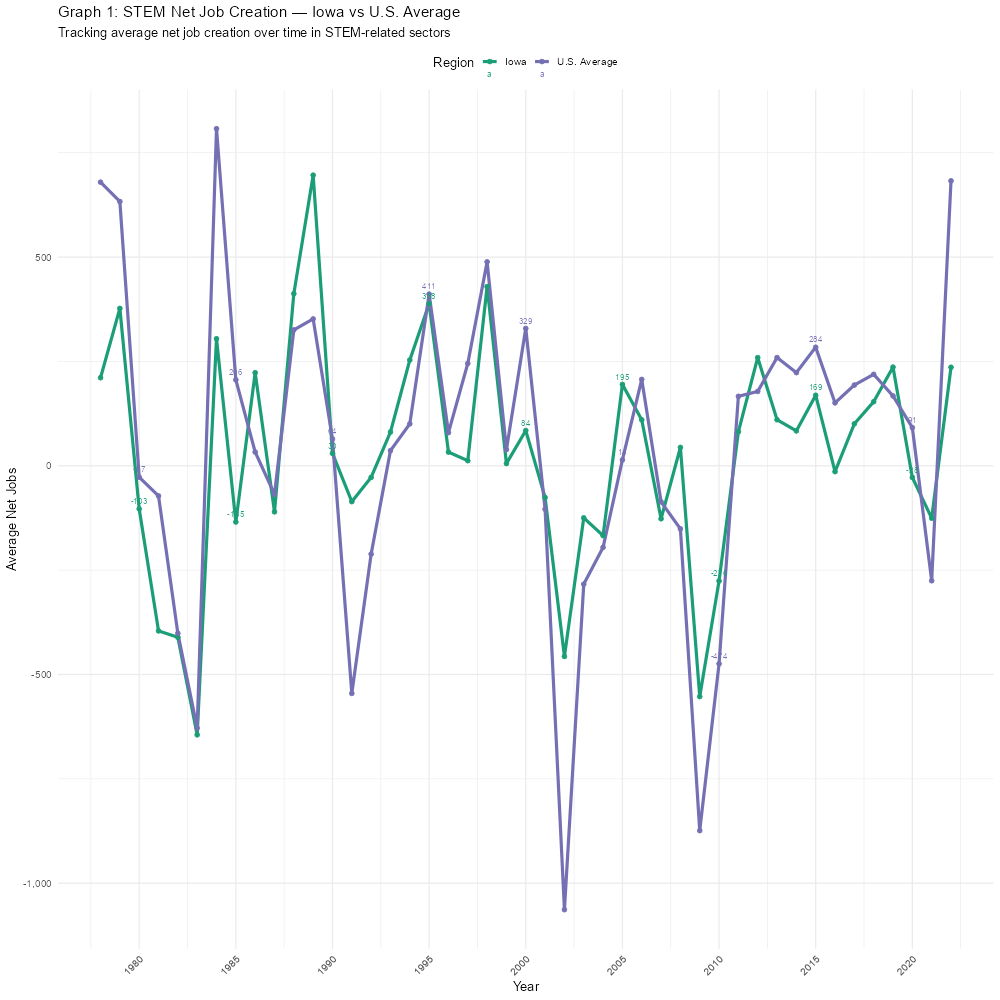
> The BDS tracks annual changes in employment, firm age, and size across industries. For this graph, I used average net job creation for STEM-related sectors in Iowa vs. the U.S. average from approximately 1980 to 2022.
Net job creation represents the number of jobs created minus those lost — it captures the actual growth in employment. STEM-related sectors reflect industries typically defined by technological and scientific innovation (e.g., high-tech manufacturing, information services, R&D).
Observations:
Volatility is High for Both Iowa and the U.S. Both lines exhibit sharp year-to-year fluctuations, especially before 2000.
This may reflect:
National economic recessions (e.g., early 1980s, 2001 dot-com crash, 2008 financial crisis).
Sector-specific disruptions (e.g., tech bubbles, automation shifts).
State-level sensitivity in smaller economies like Iowa.
Iowa Lags Behind the U.S. Average in Many Years Especially in the mid-1980s, early 2000s, and early 2010s, Iowa consistently reports lower net job creation than the national average.
Example: Around 2009–2010, the U.S. starts recovering faster than Iowa post-Great Recession. Implication: Iowa may not benefit from tech recoveries or booms as strongly as national tech hubs.
Iowa Shows Periodic Surges, it occasionally outperforms the national average, e.g., mid-1990s, around 2005, and the most recent spike (2021–2022). The most recent data point shows a sharp positive spike for both Iowa and the U.S., possibly due to post-pandemic recovery.
Surprising Insight: While Iowa trails in consistency, it is capable of strong rebounds — suggesting that local STEM ecosystems respond well to certain policies or investments.
Conclusion:
STEM-related job creation in Iowa is highly variable, with several years of underperformance relative to national averages.
Iowa lacks consistent upward STEM job trends, potentially due to lower STEM density, weaker innovation pipelines, or brain drain.
Despite this, Iowa occasionally shows strong net job creation spikes, hinting at untapped potential when conditions align (e.g., policy support, infrastructure boosts).
Long-term economic competitiveness in Iowa may depend on stabilizing and expanding STEM ecosystems, especially in urban centers and through education.
The data suggests STEM sectors offer stronger long-term resilience, aligning with national patterns of recovery and innovation.
Limitations:
Job classification and STEM definitions may vary across time and sectors.
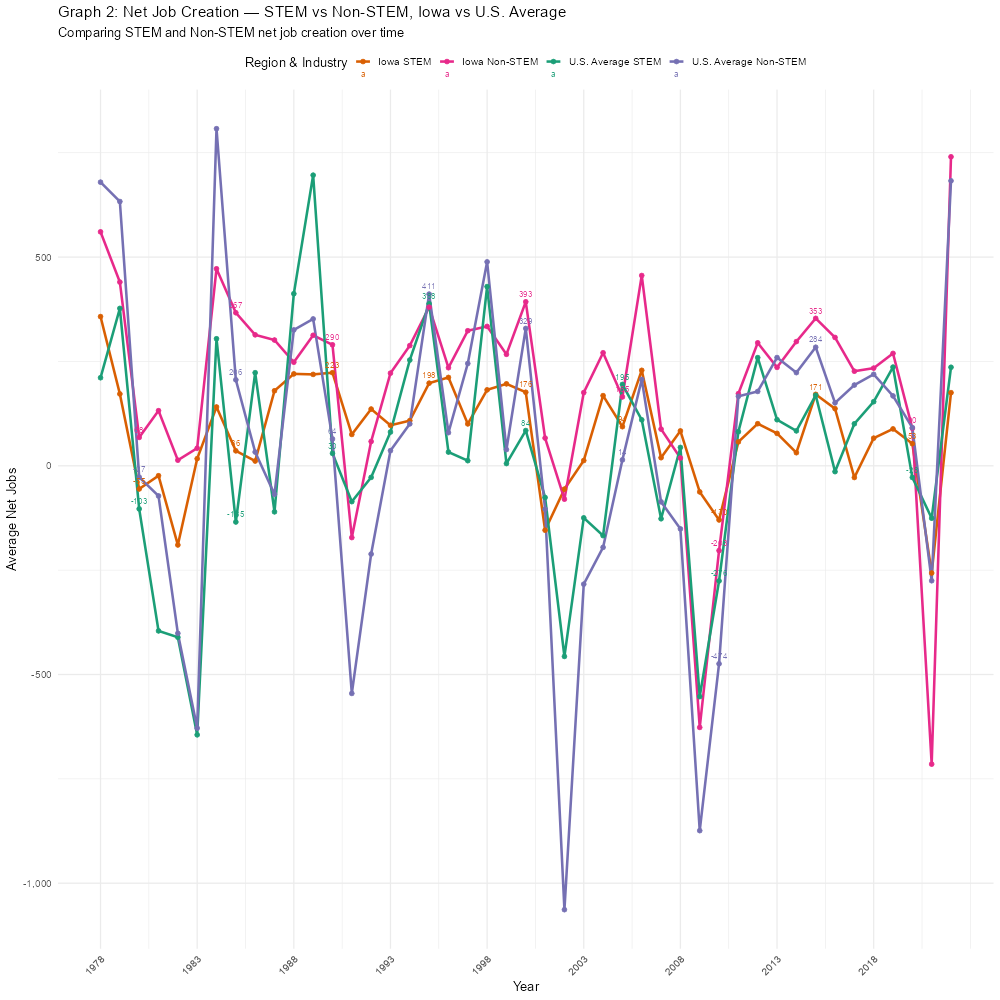
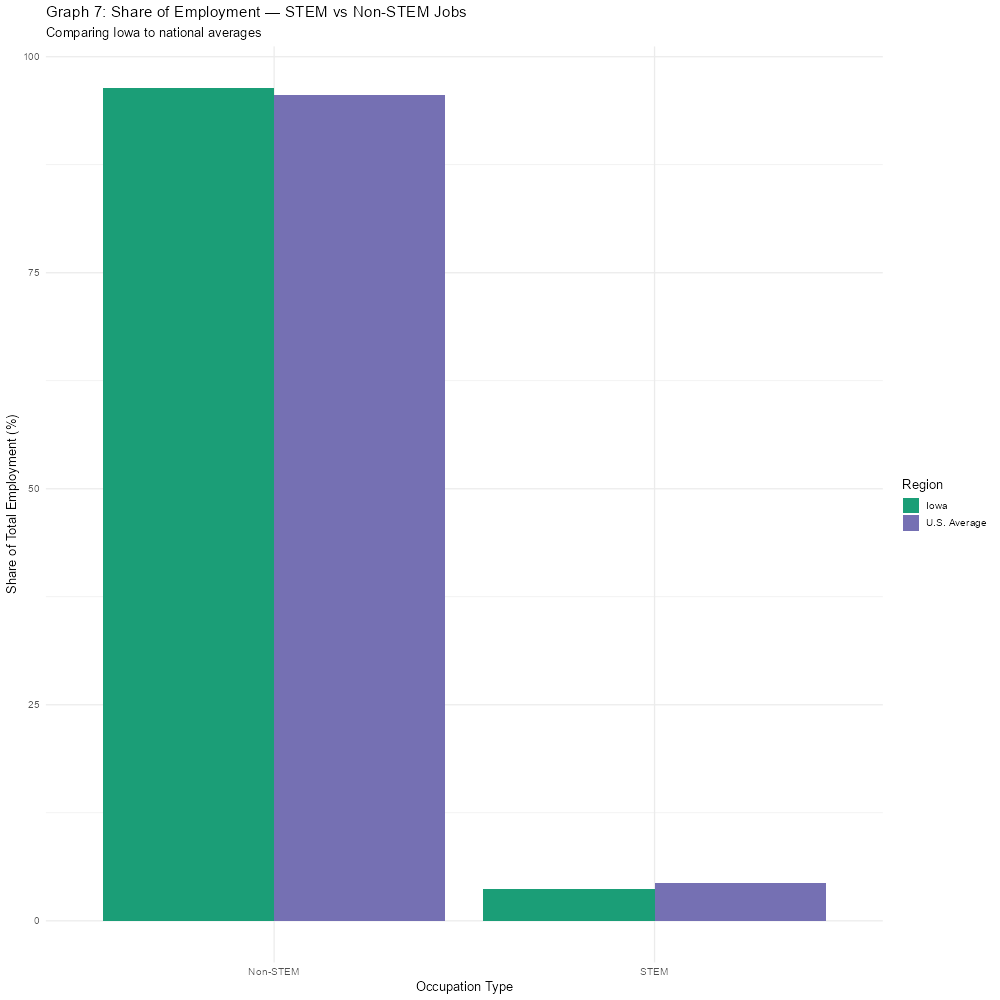
STEM vs. Non-STEM Employment Share (Iowa vs U.S.)
Observations:
STEM jobs make up a small but crucial share of the total workforce, slightly less in Iowa.
Iowa consistently shows a lower proportion of STEM employment than the national average.
STEM job share has grown over time in both Iowa and the U.S., but Iowa’s growth is slower.
Conclusion:
Despite being a small portion of employment, STEM jobs are key drivers of productivity, wages, and innovation.
Iowa’s underrepresentation in STEM jobs suggests untapped potential in sectors like advanced manufacturing, biotech, or information services.
Closing this gap requires strengthening the STEM pipeline through education, incentives, and digital infrastructure.
Limitations:
Job classification and STEM definitions may vary across time and sectors.
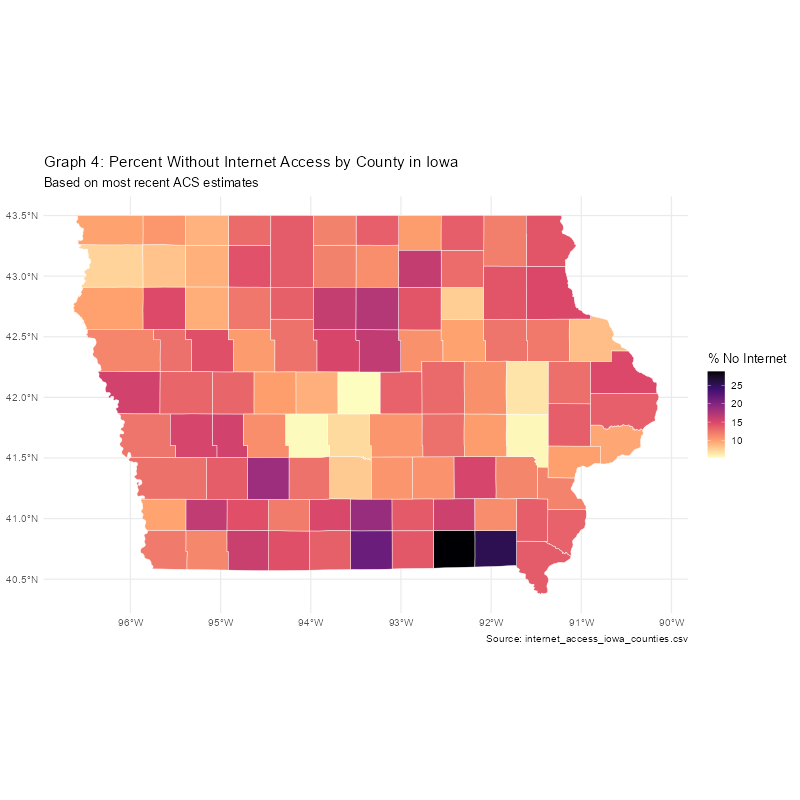
3. Internet Access and Digital Infrastructure
Source: ACS 5-Year Estimates
Observations:
Southeastern and rural counties in Iowa show internet inaccessibility rates above 25%.
Urban centers like Des Moines and Ames report better access, with under 15% of households lacking internet.
A clear urban-rural digital divide exists.
Conclusion:
Limited internet access in rural counties constrains STEM participation and digital learning.
STEM readiness — including access to remote work, online education, and tech entrepreneurship — is directly tied to internet availability.
Investments in broadband expansion can reduce regional disparities and boost Iowa’s STEM workforce.
Limitations:
Self-reported internet access may not reflect quality (speed, reliability).
Iowa lags behind states like California and Texas in total STEM export value.
Conclusion:
STEM sectors are critical for international competitiveness and economic diversification.
Iowa’s lower share of STEM exports reflects under-leveraged potential in advanced manufacturing and R&D.
Policies that support STEM startups, trade incentives, and global partnerships can help Iowa scale its innovation economy.
Limitations:
Export data may aggregate STEM and non-STEM subcategories within the same product classification.
5. Innovation and Patents
Source: USPTO, Milken Institute, NSF Innovation Index
We have not yet explored this dataset in detail, as it is in a different file format and requires additional time to process and clean. This is a potential area for future analysis, especially as we investigate the relationship between STEM workforce development and innovation outcomes in Iowa.
Why It Matters:
Patent filings are often used as a proxy for regional innovation and long-term economic competitiveness.
States with higher patent activity tend to have stronger STEM employment bases and higher GDP per capita.
Exploring Iowa’s patent trends can reveal gaps or strengths in its research ecosystem, commercialization, and high-tech entrepreneurship.
Future Steps:
Convert and process the USPTO/Milken data for state- and MSA-level comparison.
Explore correlations between patent filings, university research activity, and business startups in Iowa.
Visualize trends in patent types (e.g., biotech, software, mechanical) to better understand Iowa’s innovation landscape.
Job market demand: Projected Growth
Tried to verify whether the projected job growth rate (for STEM and non-STEM) in Iowa is similar to that in the USA. For this, we need a dataset with:
Projected job growth
STEM work field
Data from only Iowa
Found these datasets from Iowa Workforce Development:
2022-2032 State Occ Projs, 12-2024.xlsx – provides the long-term projection data for state-wide Iowa
df <-read.csv("Data/2022-2032 State Occ Projs, 12-2024.csv")tail(df[, c(1, 2)], 5)
    X2022.2032.STATE.OF.IOWA.OCCUPATIONAL.PROJECTIONS
634                                           53-7064
635                                           53-7065
636                                           53-7081
637                                           53-7121
638                                           53-7199
                                       ...2
634               Packers & Packagers, Hand
635                Stockers & Order Fillers
636 Refuse & Recyclable Material Collectors
637         Tank Car, Truck, & Ship Loaders
638      Material Moving Workers, All Other
2023-2025 State Occ Projs 10-2024 (revised).xlsx – provides the short-term projection data for state-wide Iowa
df <-read.csv("Data/2023-2025 State Occ Projs 10-2024 (revised).csv")tail(df[, c(1, 2)], 5)
    X2023.2025.STATE.OF.IOWA.OCCUPATIONAL.PROJECTIONS
633                                           53-7064
634                                           53-7065
635                                           53-7081
636                                           53-7121
637                                           53-7199
                                       ...2
633               Packers & Packagers, Hand
634                Stockers & Order Fillers
635 Refuse & Recyclable Material Collectors
636         Tank Car, Truck, & Ship Loaders
637      Material Moving Workers, All Other
OccProj Combined Data.csv – contains both the long-term, and short-term projection data for state-wide Iowa as well as specific regions of Iow
The projection for 2022-32, employment in Iowa exceeds the national average, with a 13.41% increase in STEM occupations, and 6.23% increase in non-STEM occupations.
The annual growth rate obtained through long-term projection is higher than the one obtained through short-term projection
Some limitations to mention:
The method of calculating the annual projection is not mathematically correct and does not consider the compounding effect over the years.
The methodology with which the Iowa Workforce Development came up with the projection is not investigated
Job market demand: unemployment
What are the unemployment differences between STEM and non-STEM careers?
What is the specific situation for Iowa?
What is the percentage of STEM attrition? (STEM attrition is the phenomenon of having a STEM degree but not working in a STEM-related job)
I used the ACS Public Use Microdata Sample PUMS from 2018-2023. The data includes information at household and individual levels. Because the PUMS works with small samples, it includes weights, which represent an estimate of how many more houses or individuals have a similar profile to an individual or house.
Iowa is in the 4th place in the lowest STEM unemployment percentages
Iowa STEM attrition is 49.5%, which could represent an untapped population that could be ready to work on STEM opportunities
Iowa STEM Indicators
A crucial answer is how to quantify STEM education. In 2022, the Iowa Education Bureau defined 12 indicators that potentially can be used to quantify it.
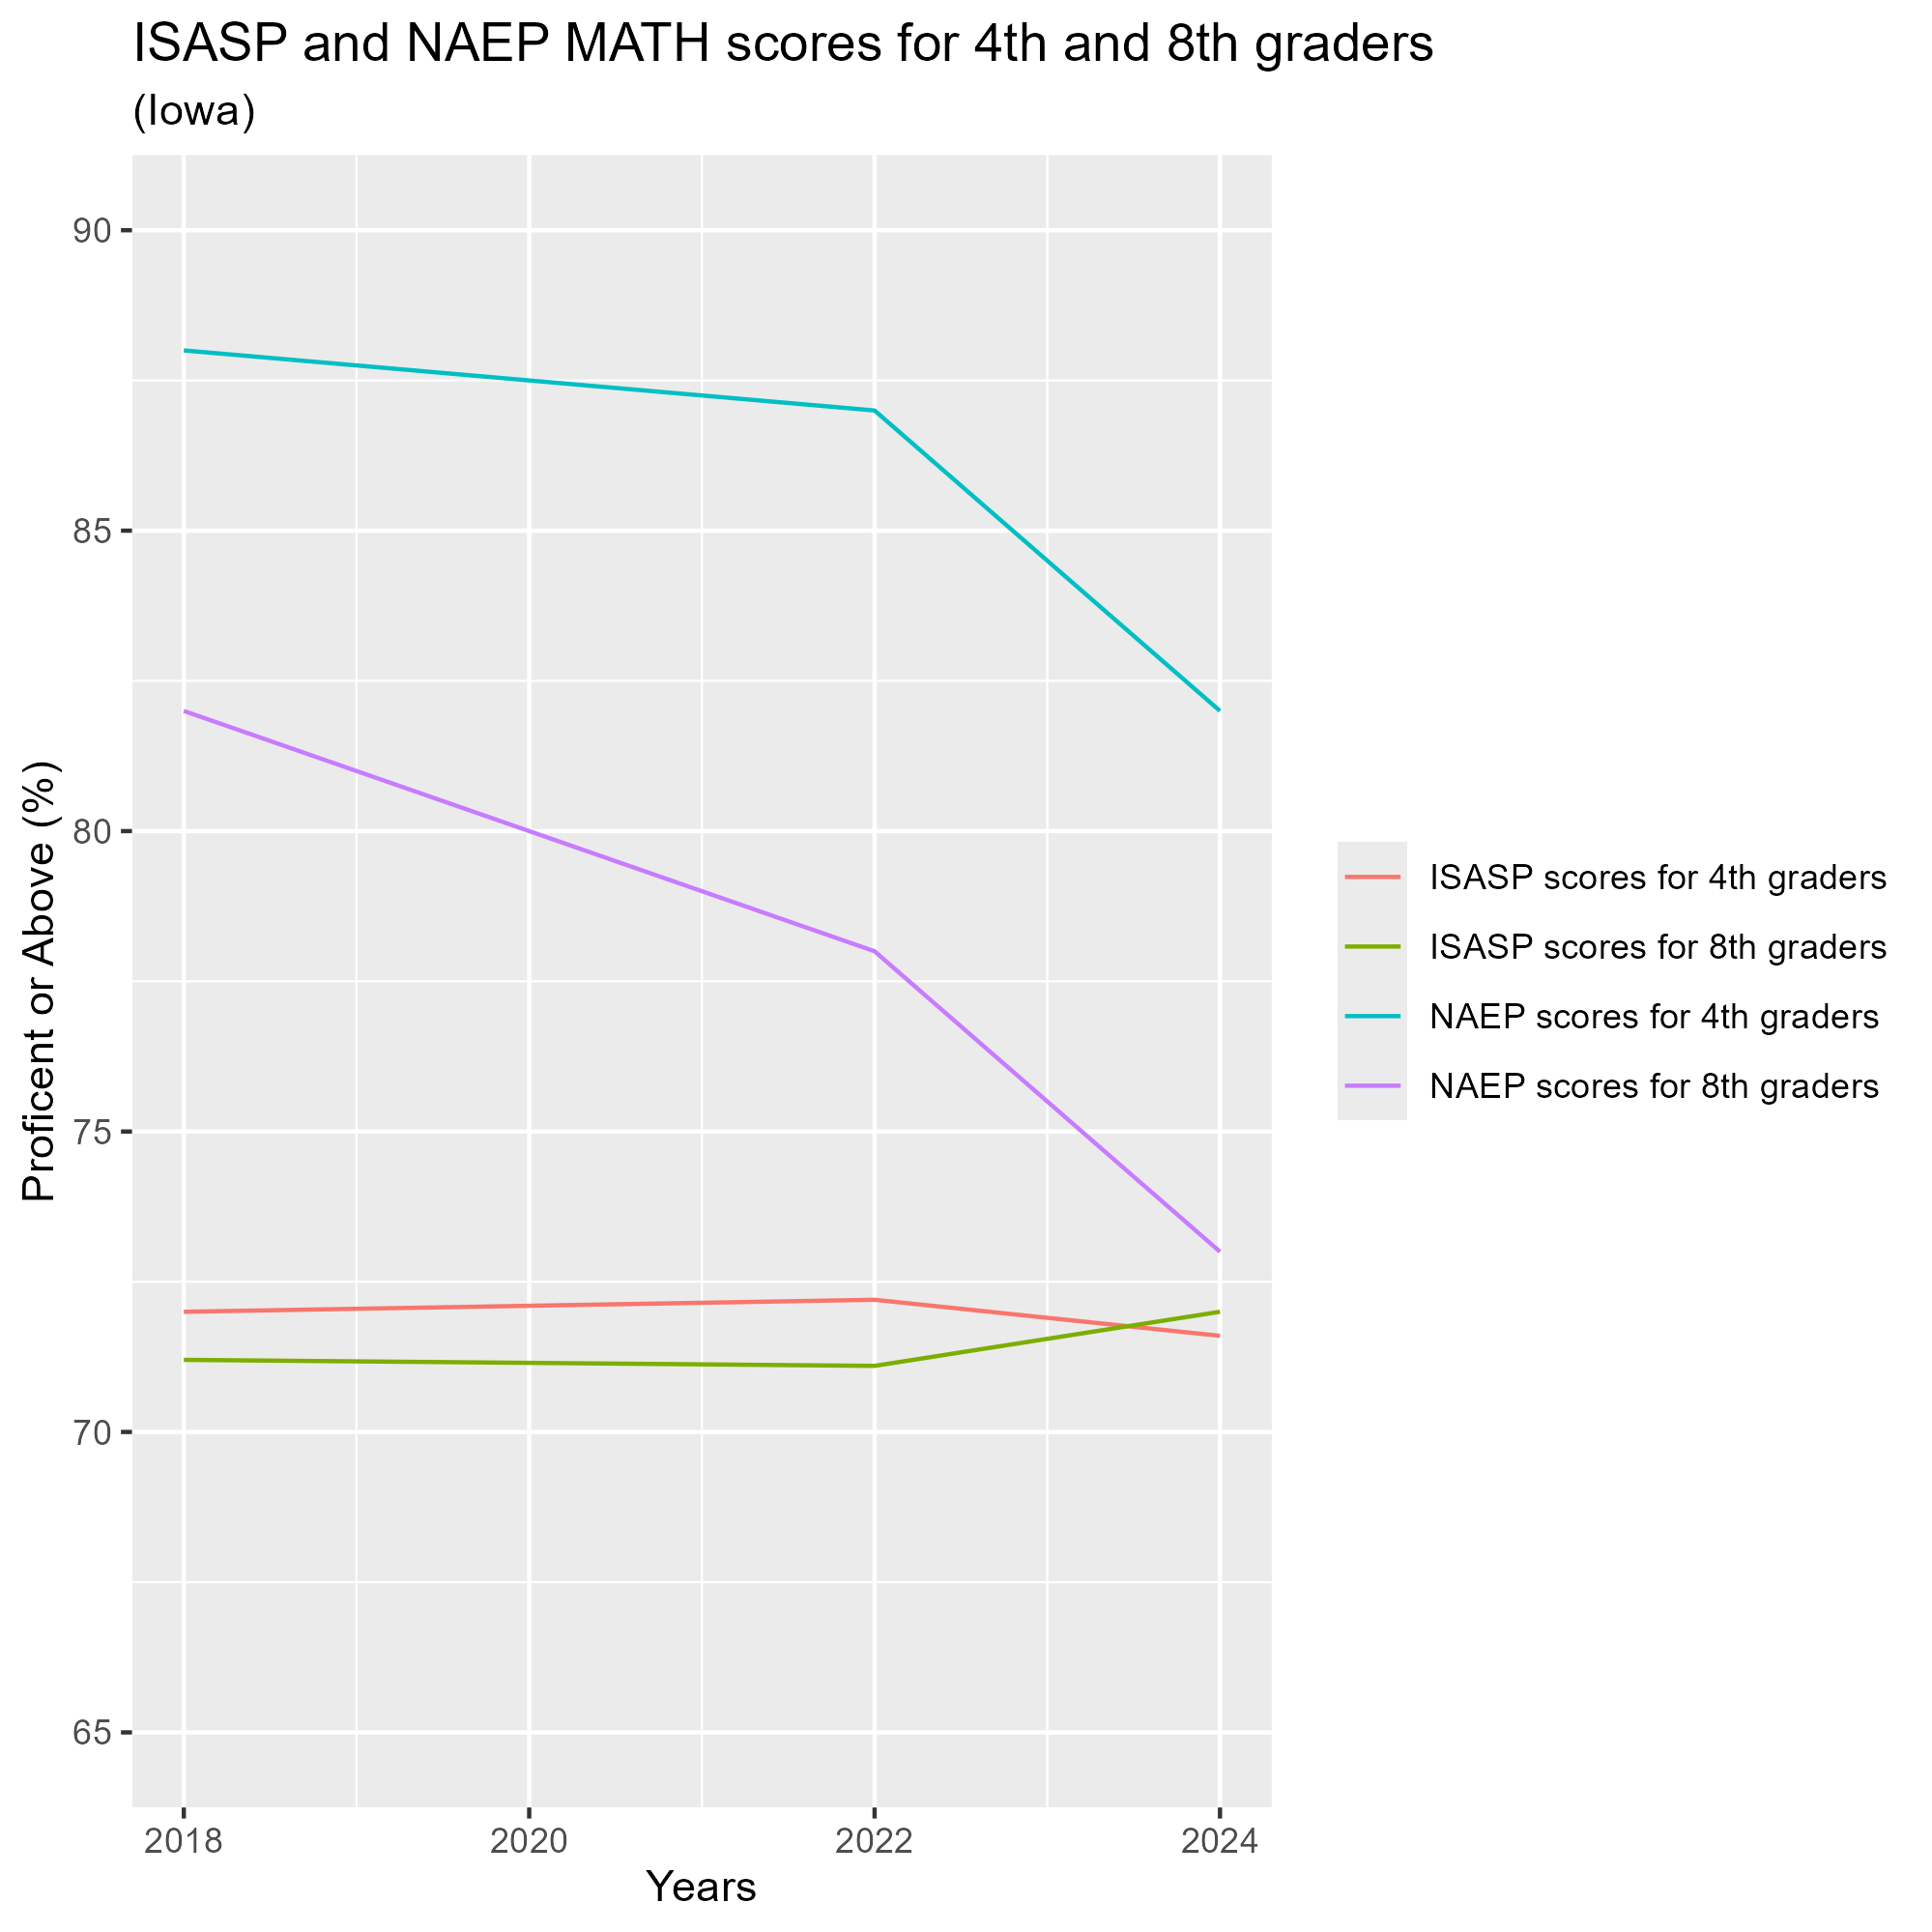
Indicator: Iowa student achievement in ISASP and NAEP mathematics tests
math_scores_plot
Key Insight:
NAEP scores are declining significantly across both grades.
ISASP scores are more stable, but consistently lower than NAEP scores.
These declines could be due to COVID
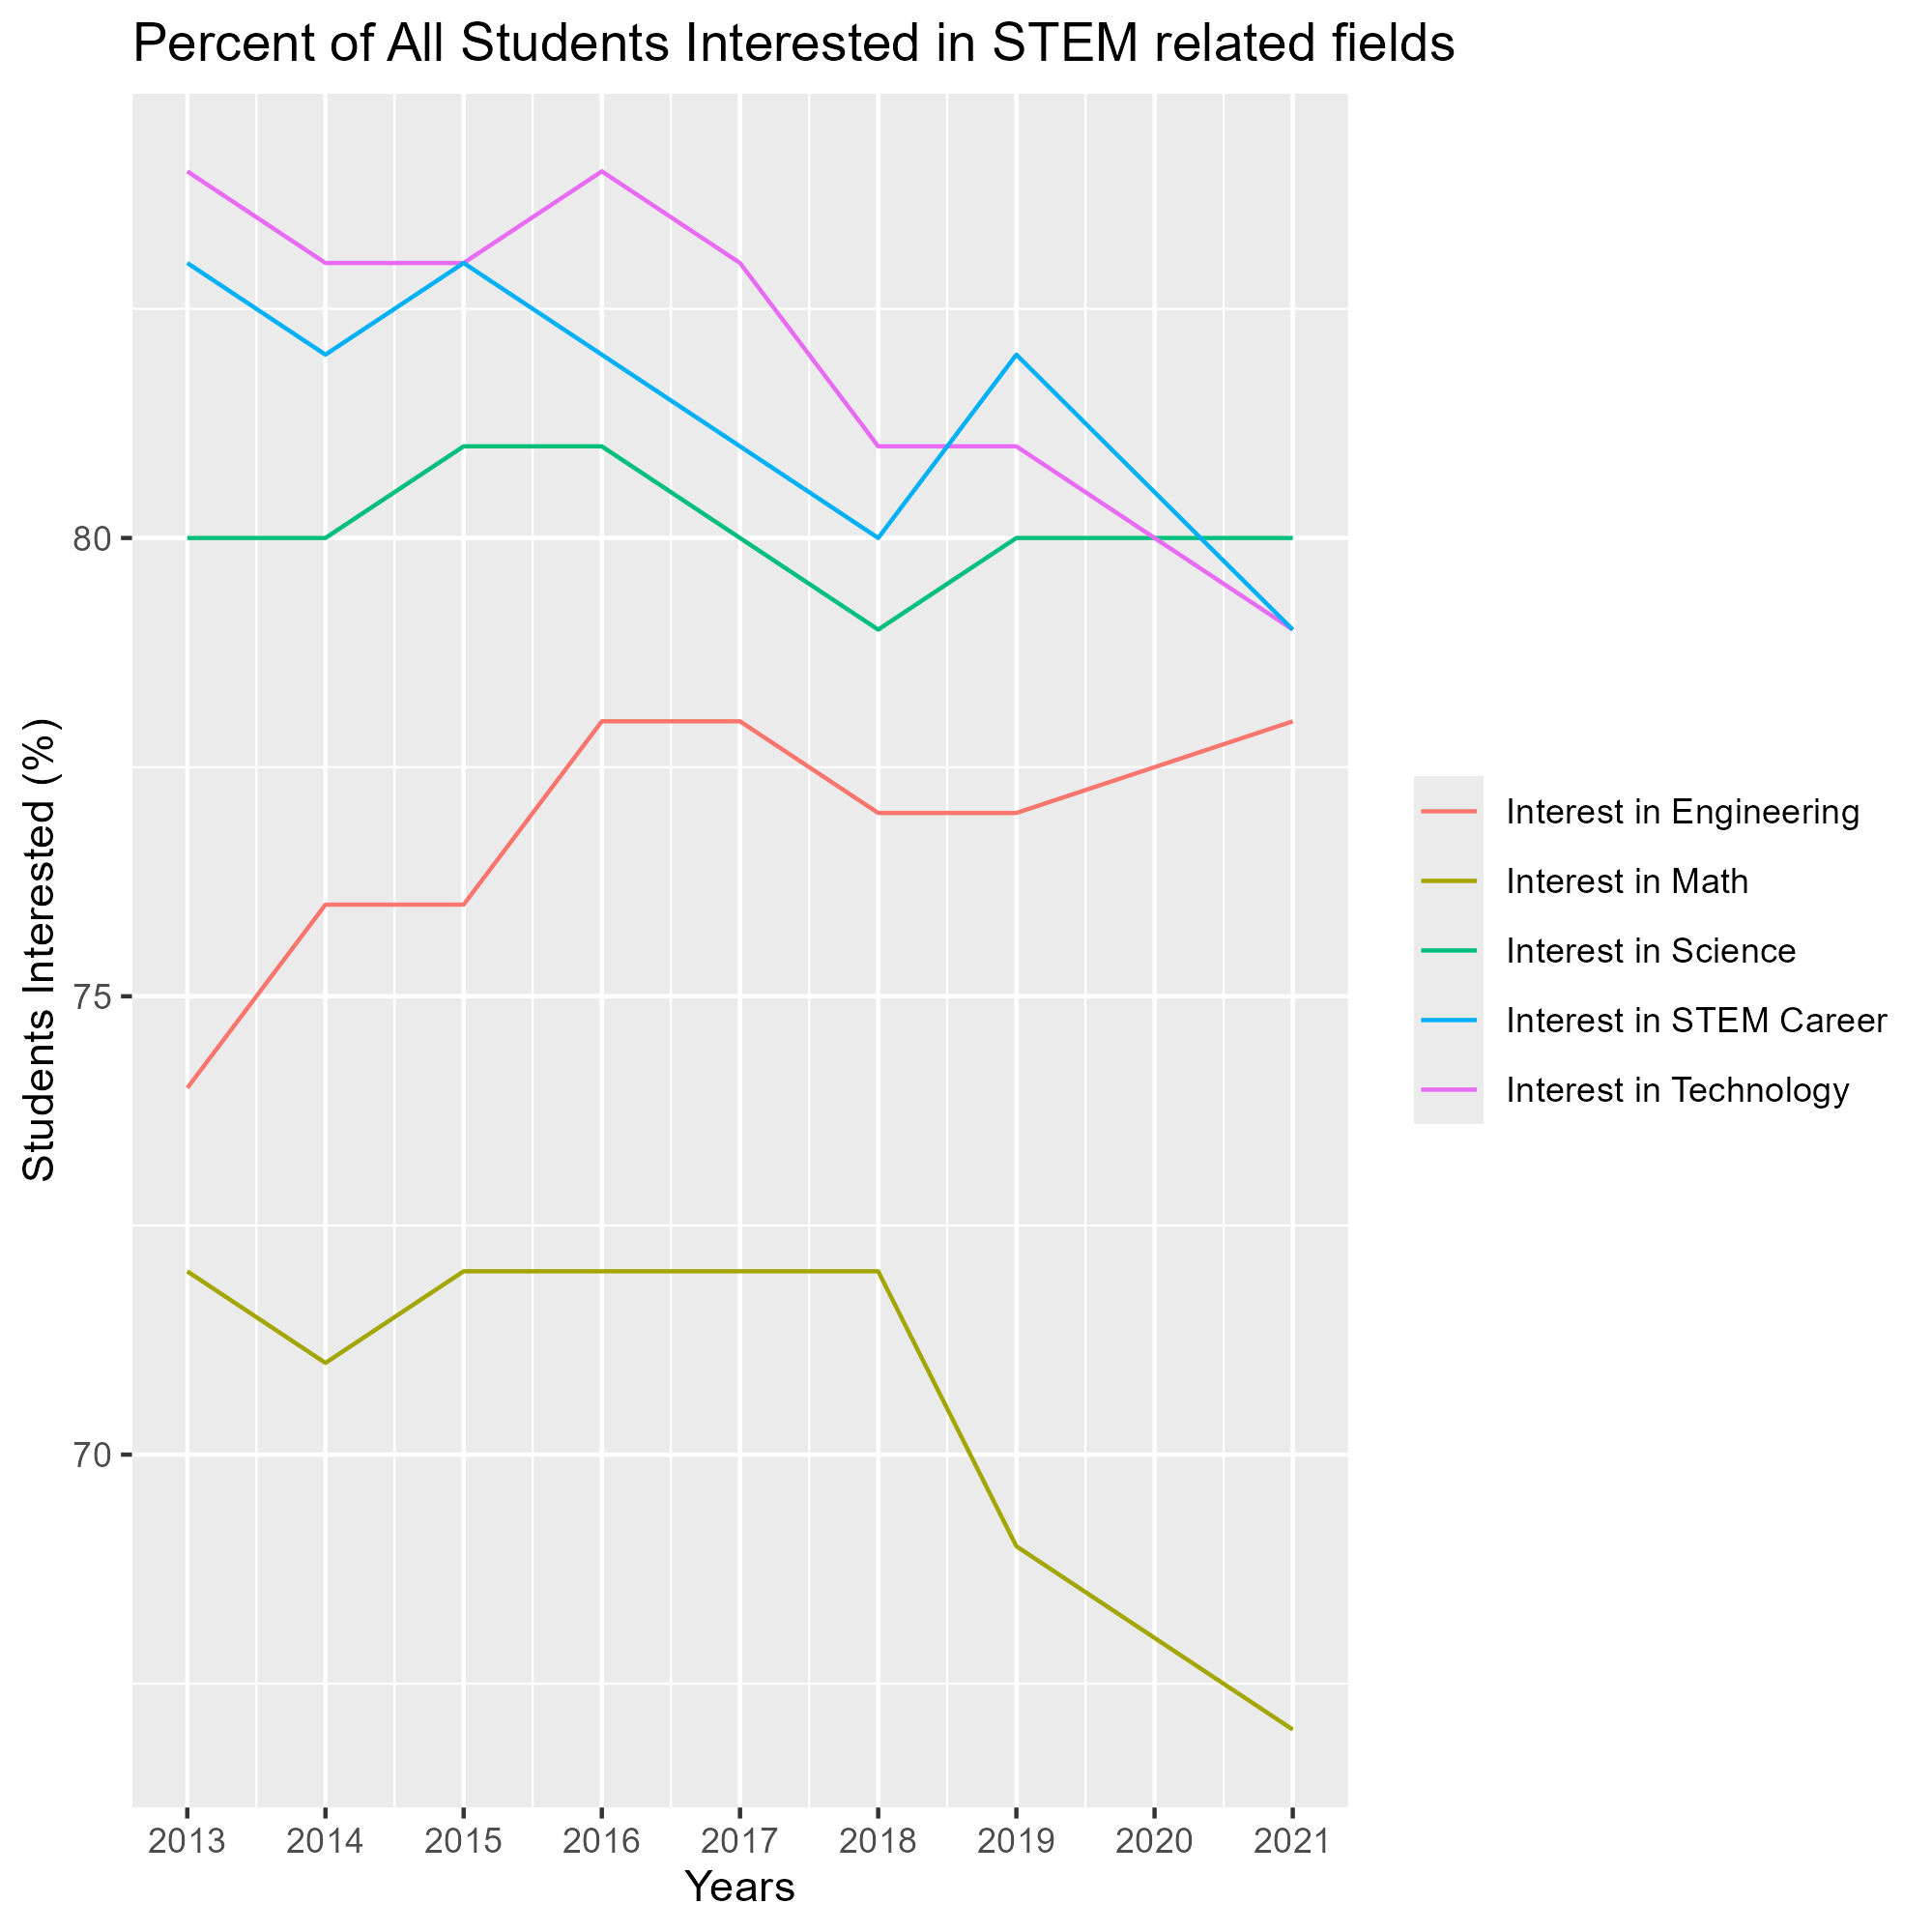
Indicator: Total Number of Students in Iowa intertested in STEM fields/career
Initial Graph:
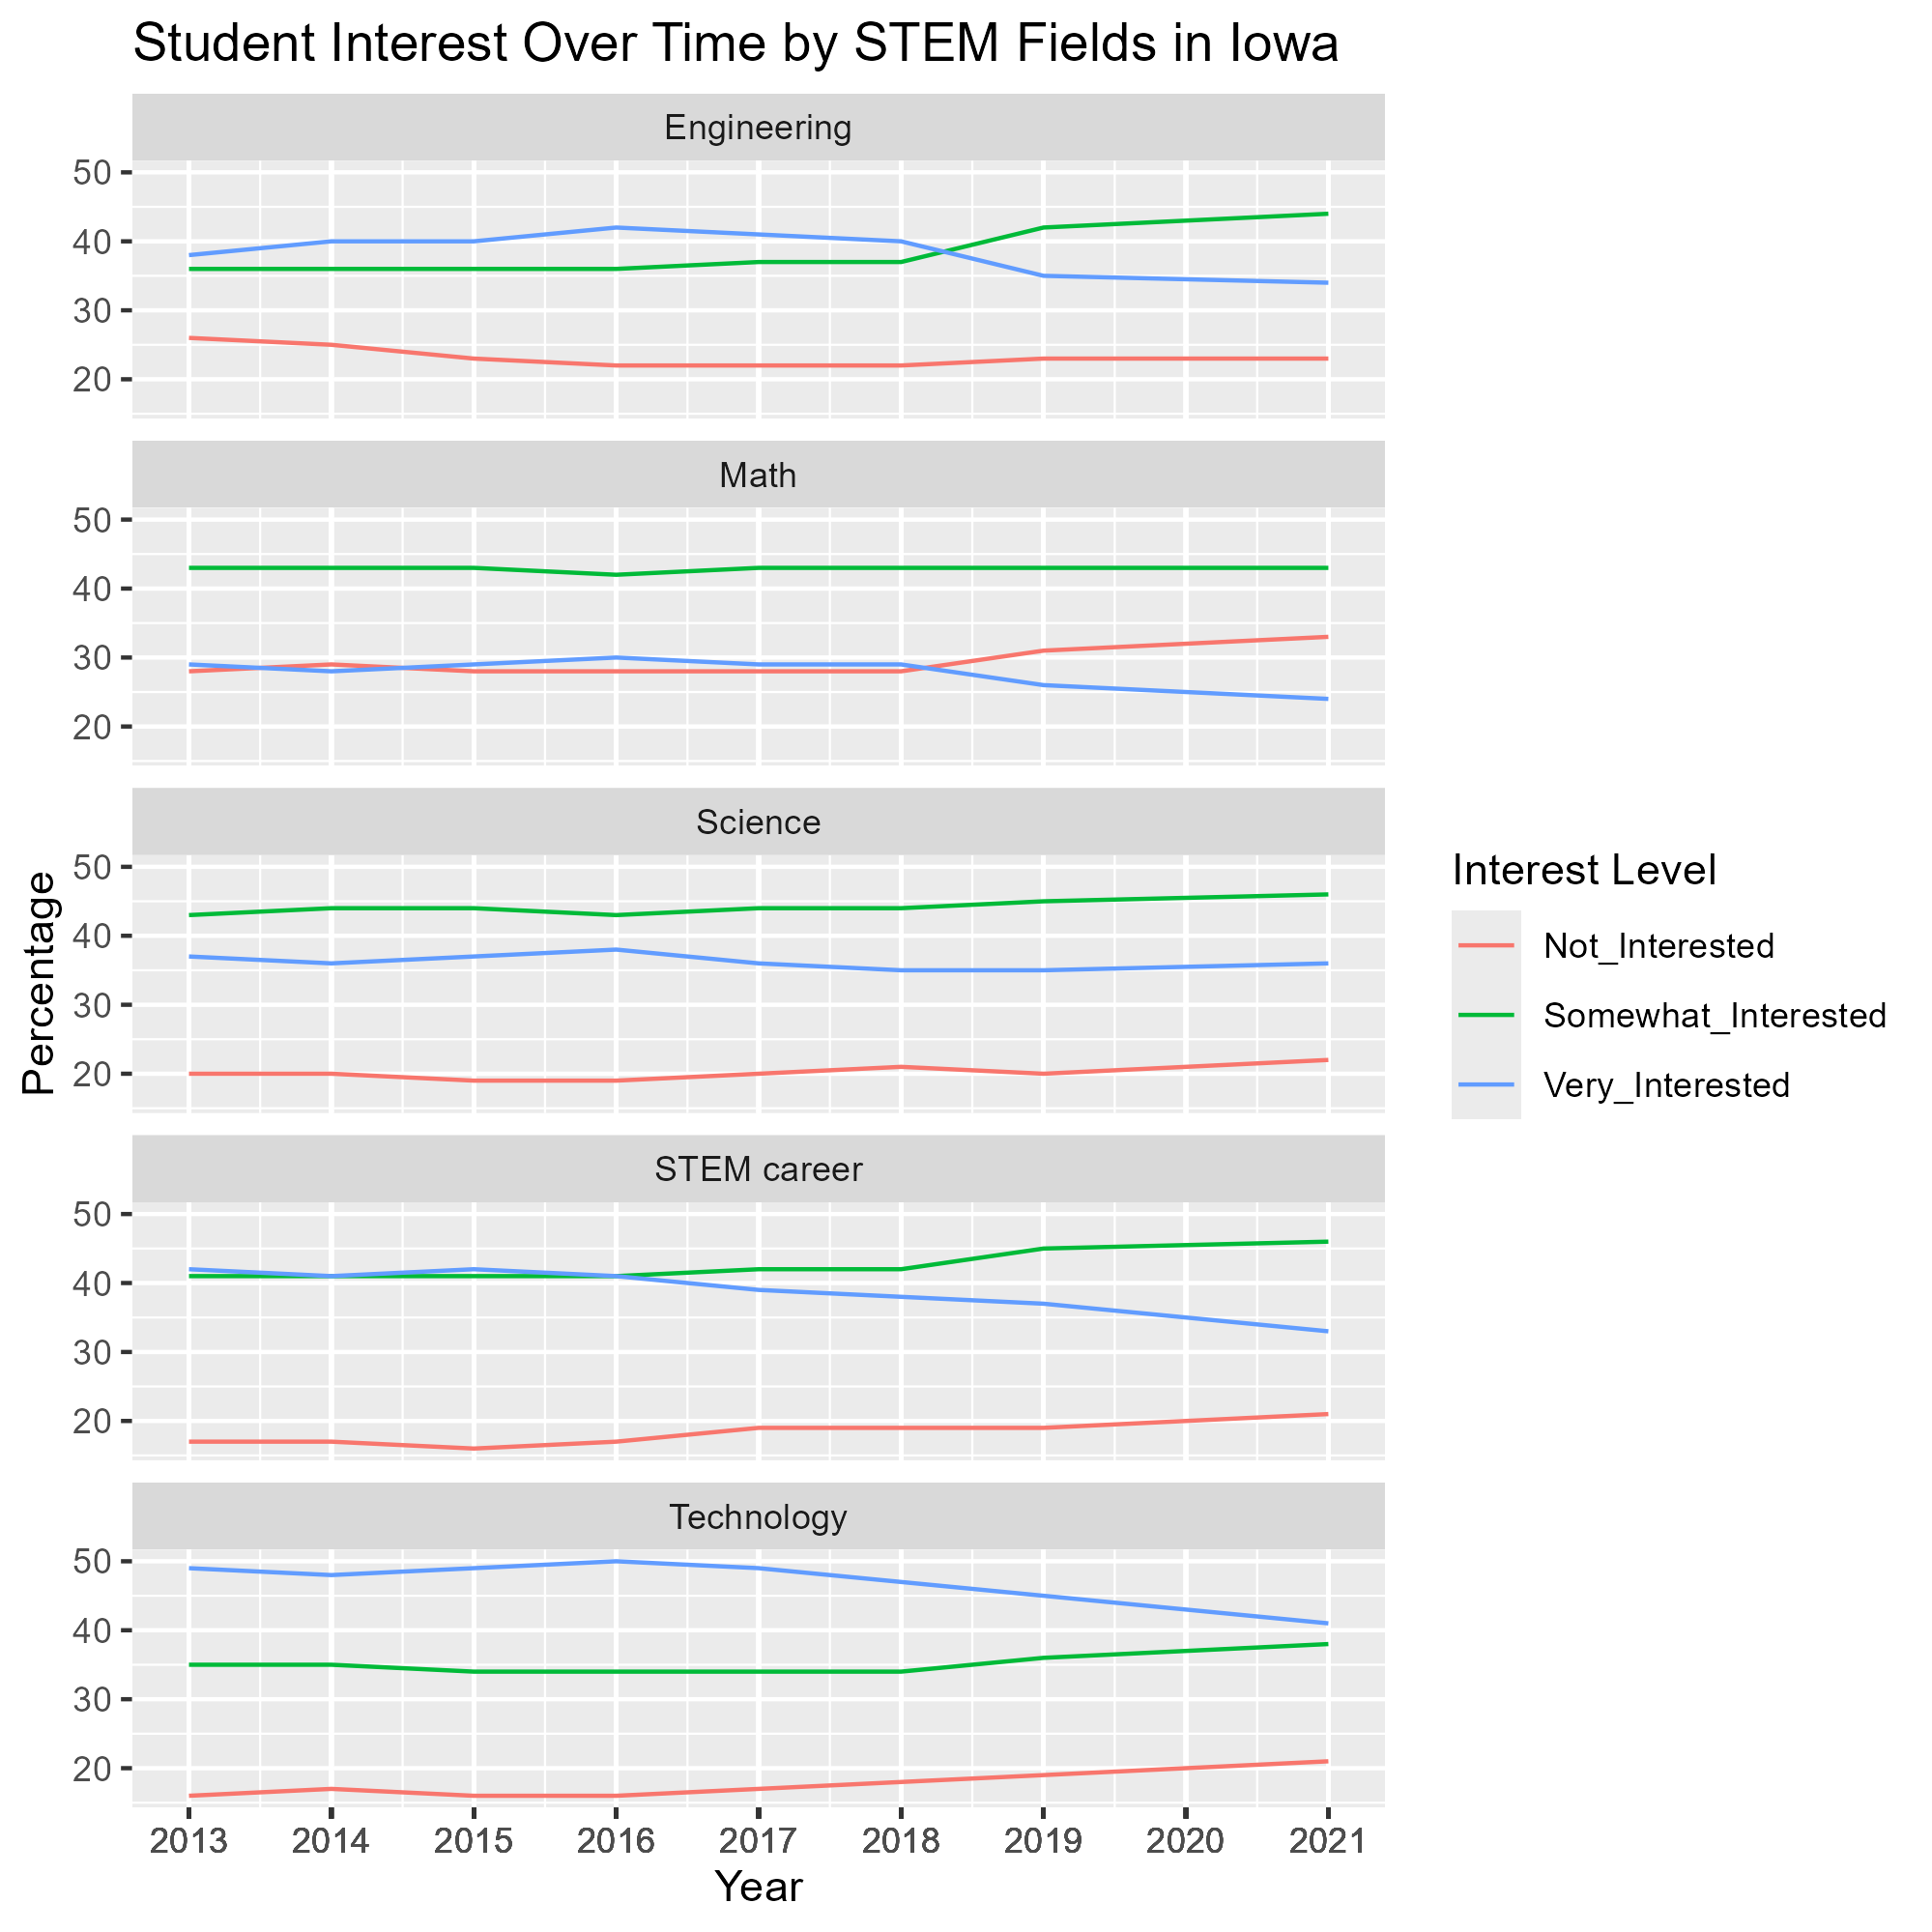
I decided to update the graph because the original data actually separated responses into “Very Interested”, “Somewhat Interested”, and “Not Interested”. The first version of the graph had lumped everything into just “Interested” and “Not Interested”, which oversimplified things. To better represent the full range of student interest, I made a new graph that shows all three categories separately.
student_interest_plot_2
This faceted graph displays trends in students’ interest levels across different STEM fields or careers, showing how interest has changed over time within each field.
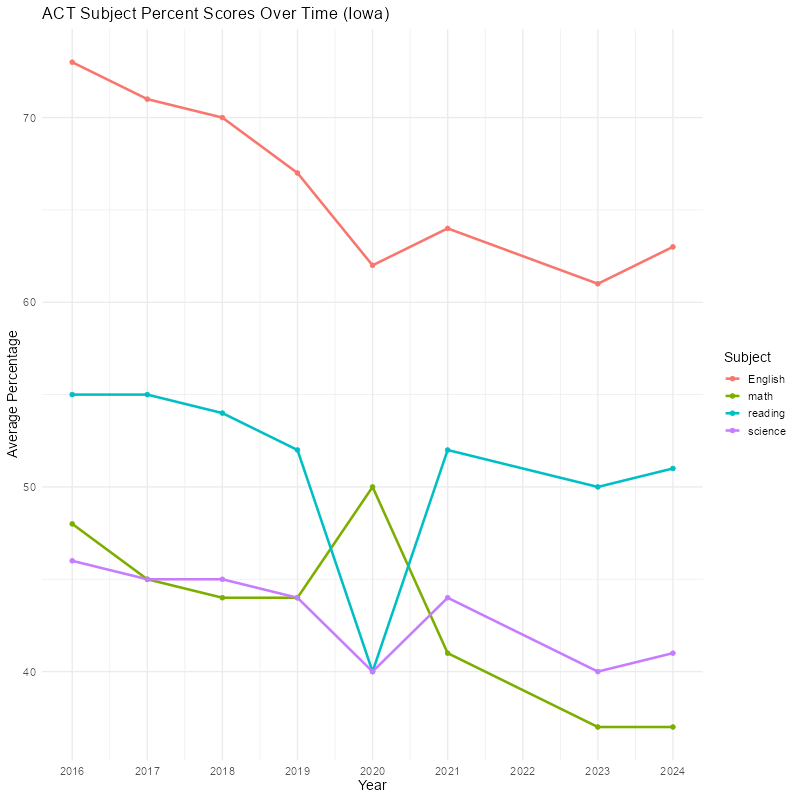
Indicator: Number of students taking the ACT and average scores in mathematics, science, and STEM
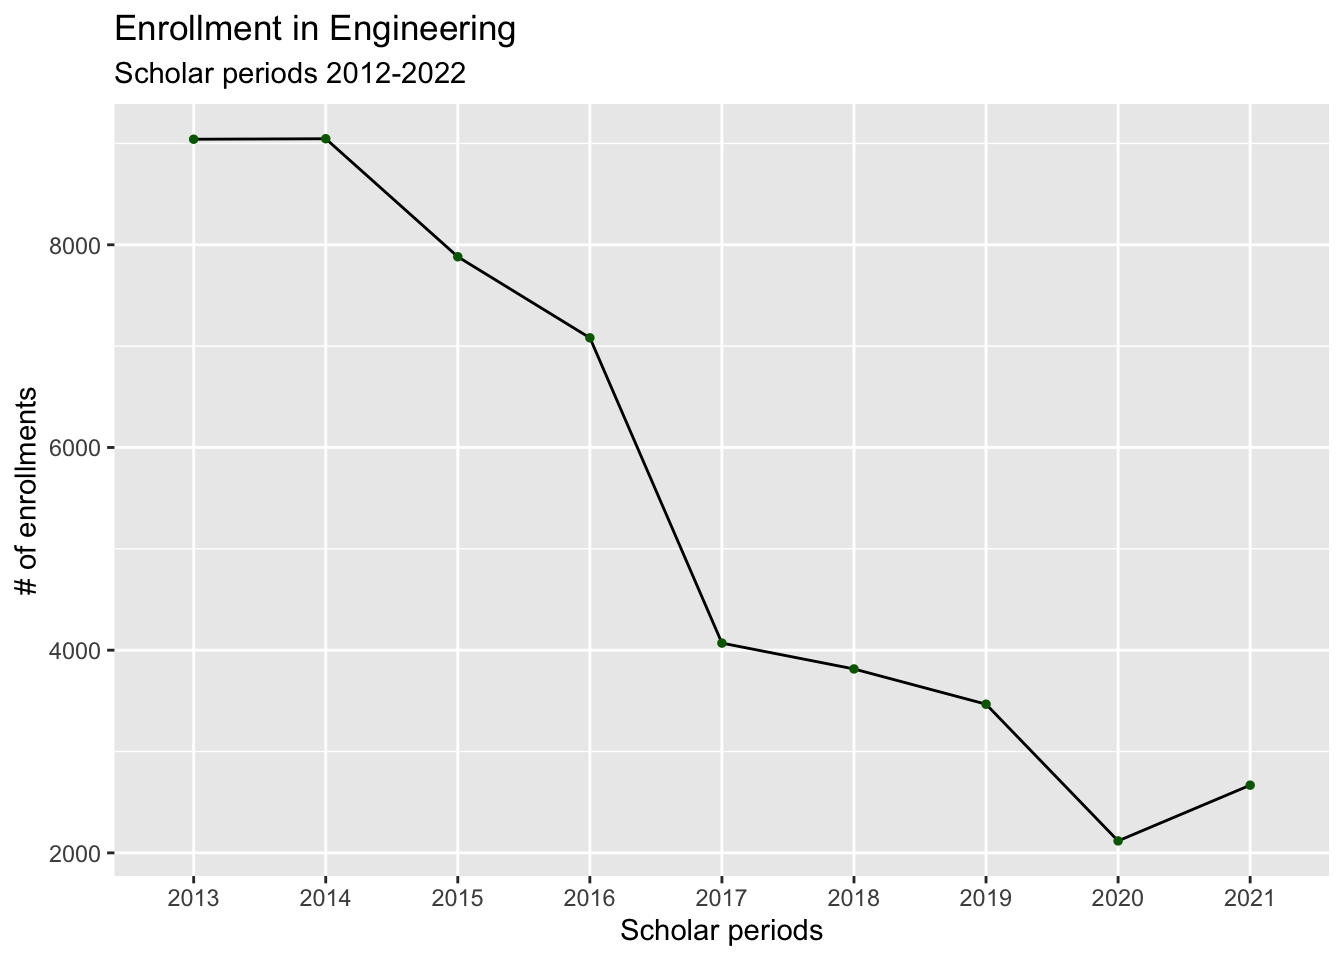
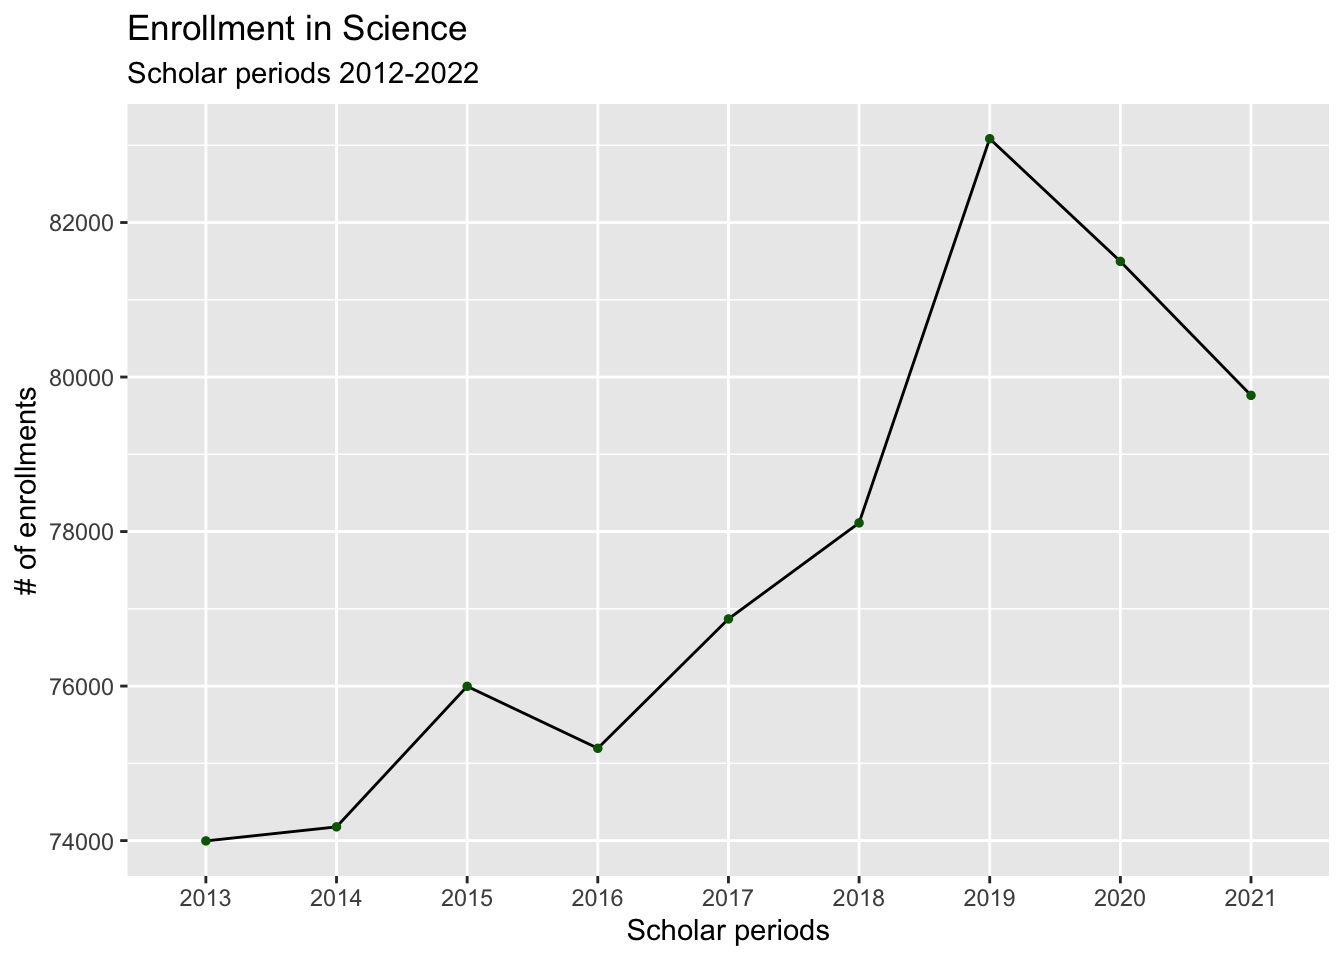
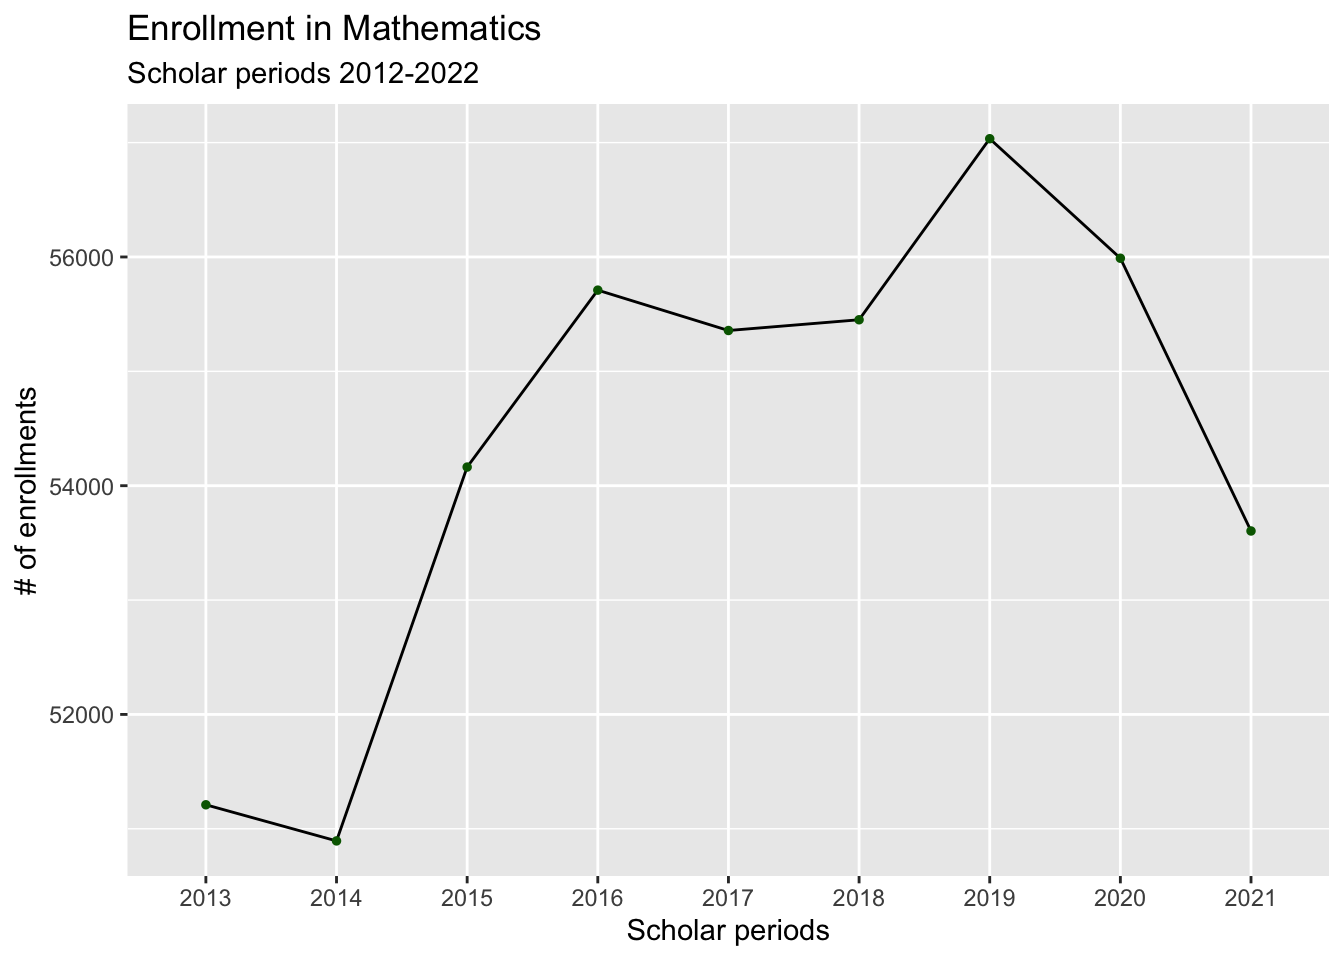
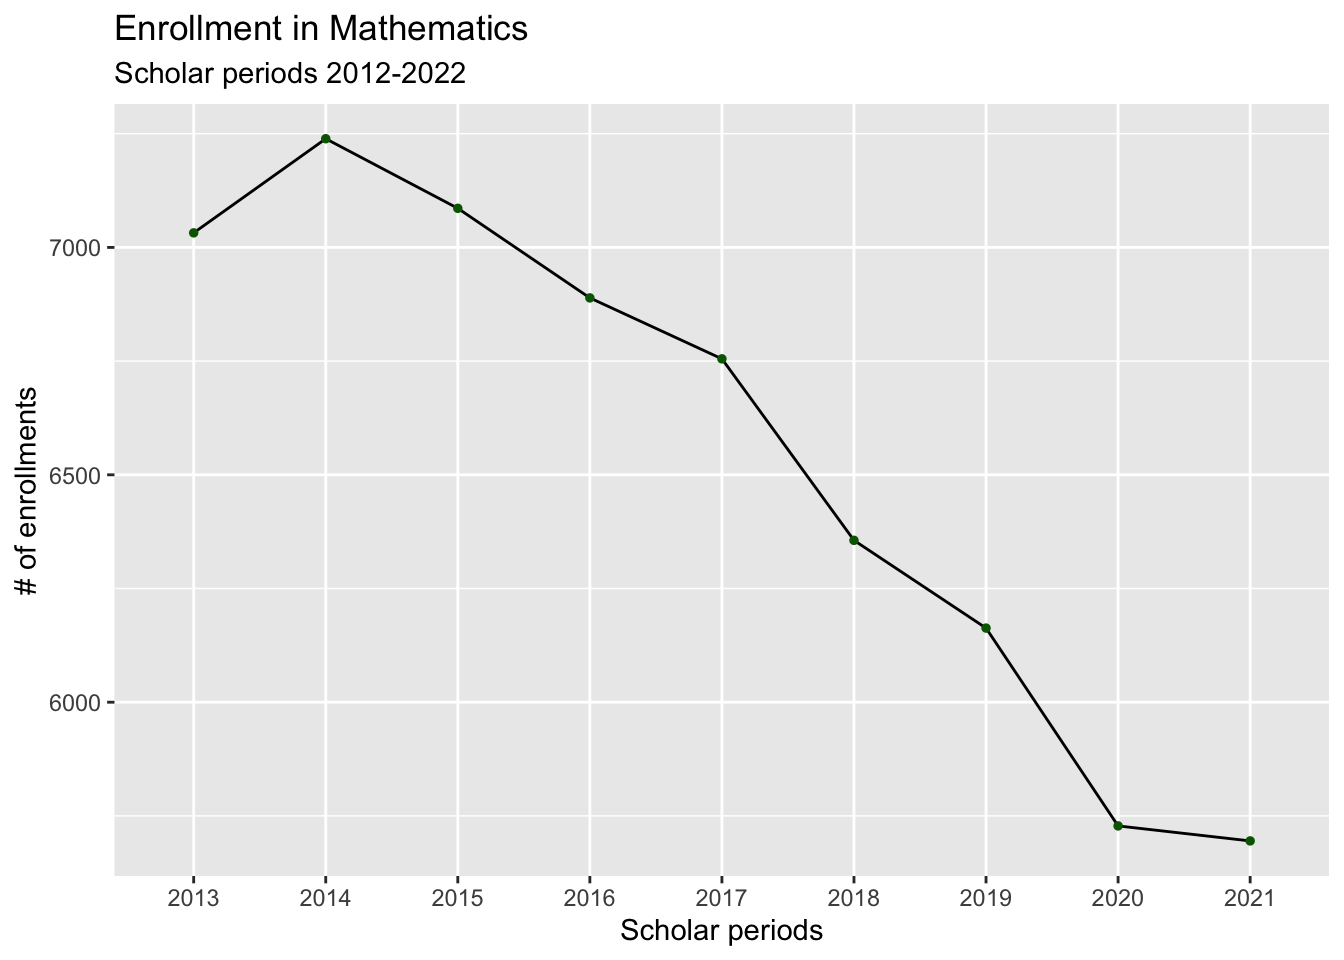
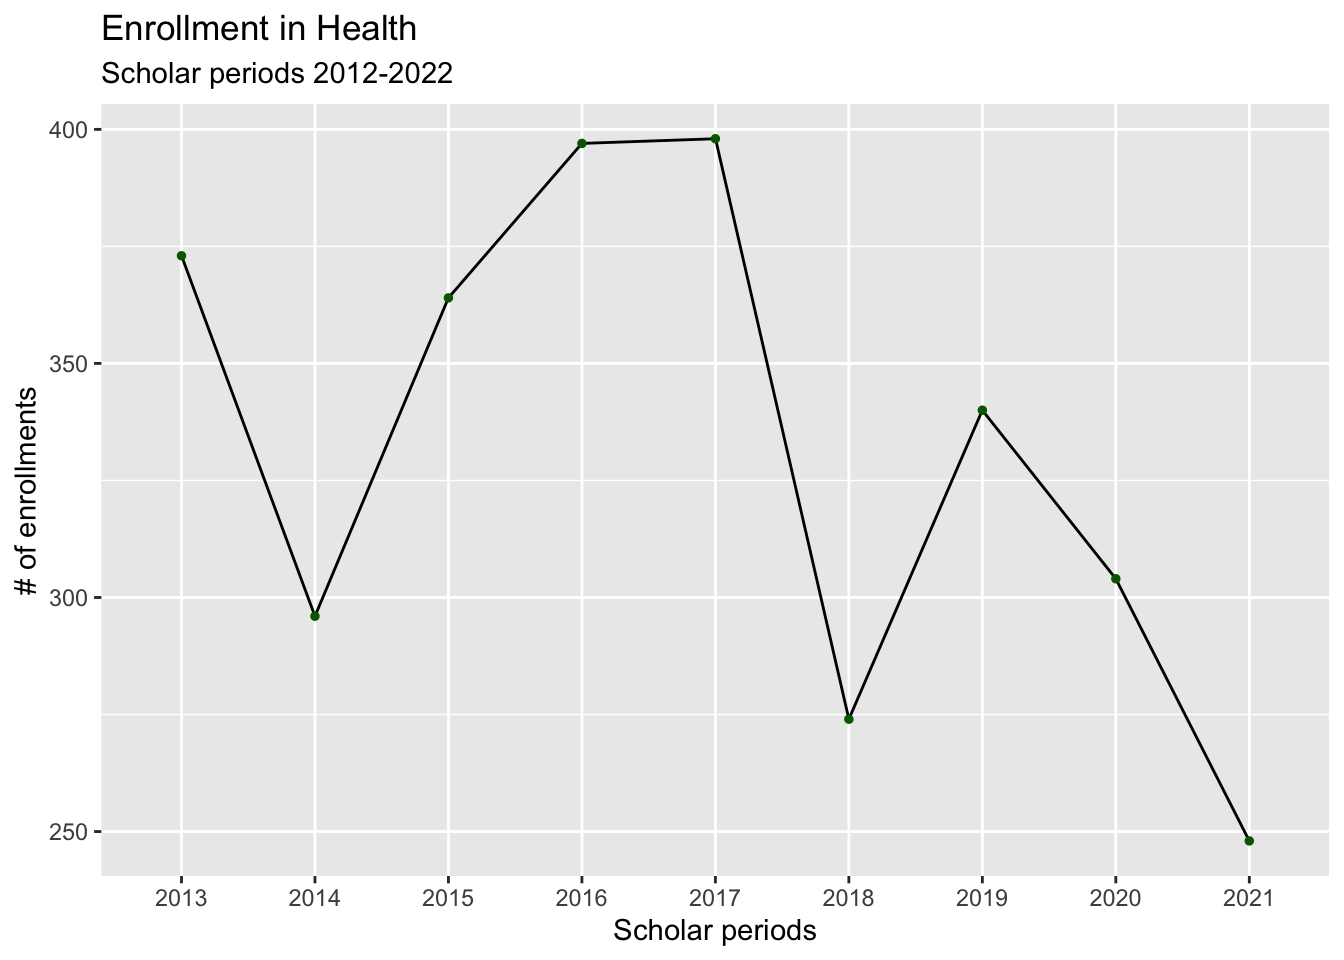
Indicator: Enrollment in STEM-related courses in high school
The Iowa annual evaluation reports from 2013-2021 were used for this indicator.
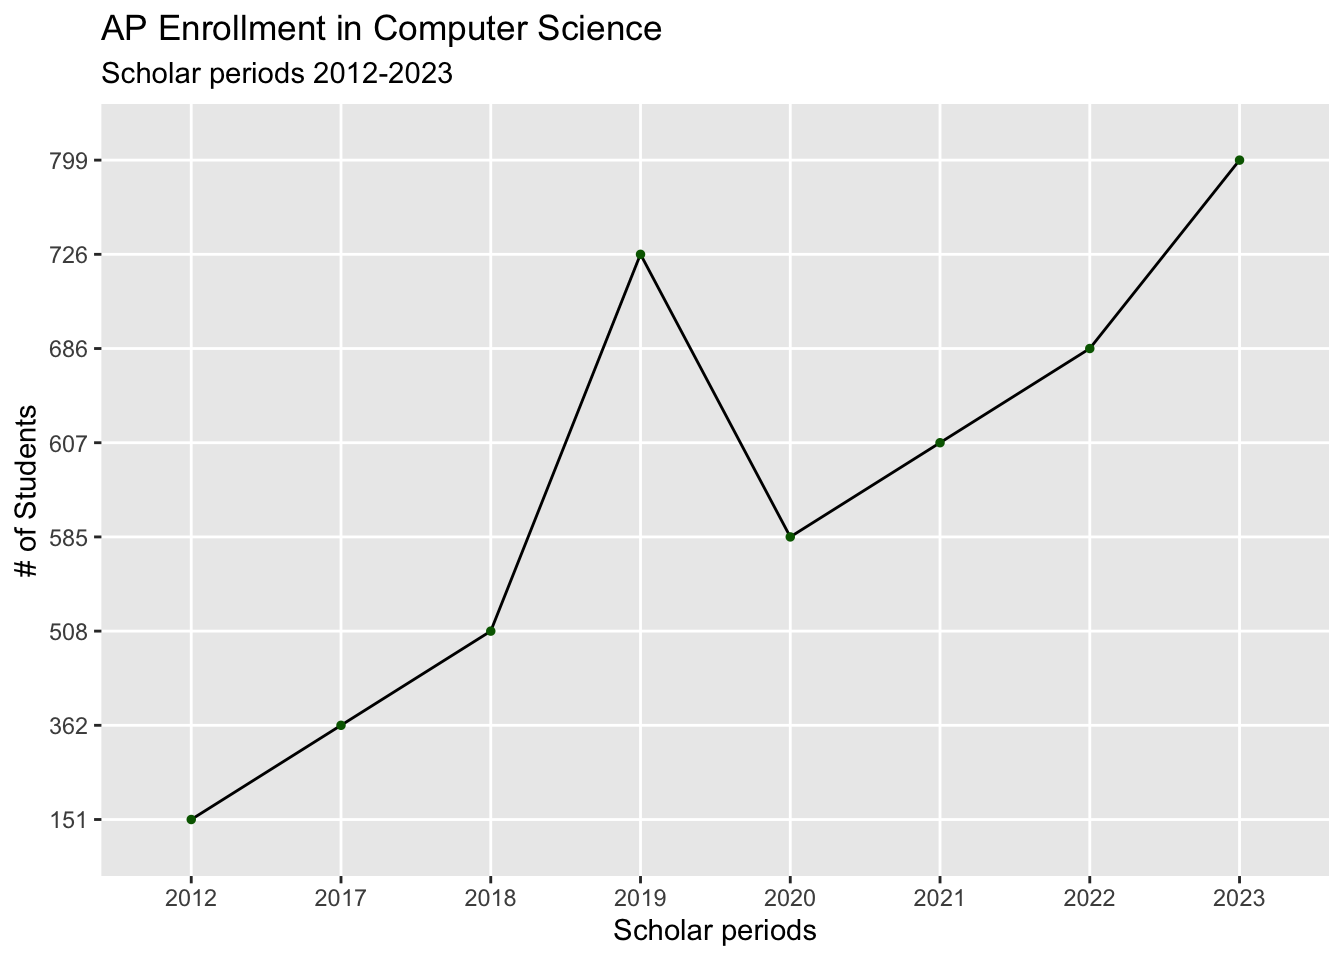
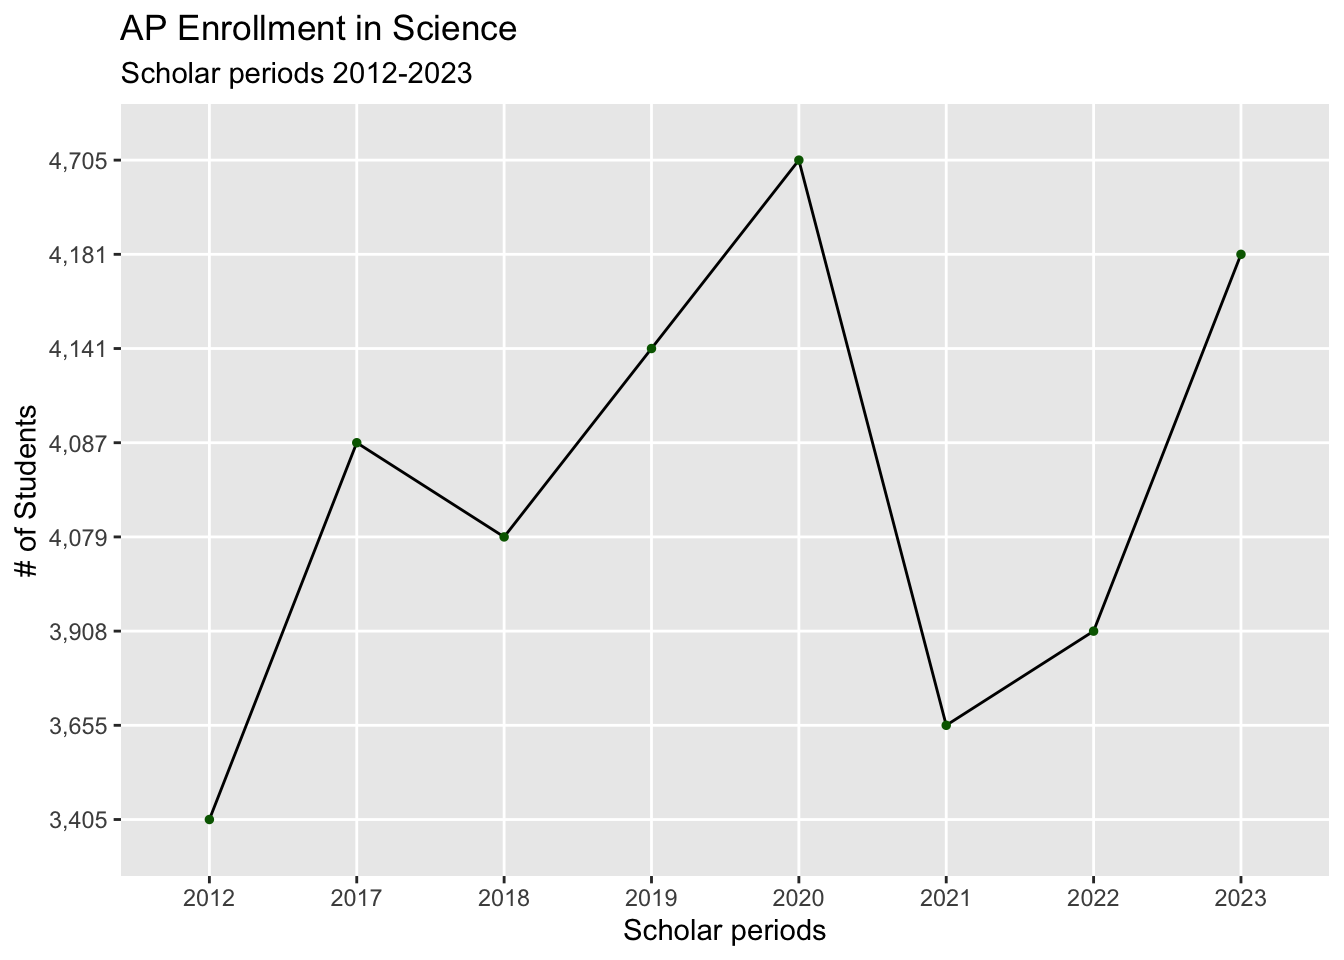
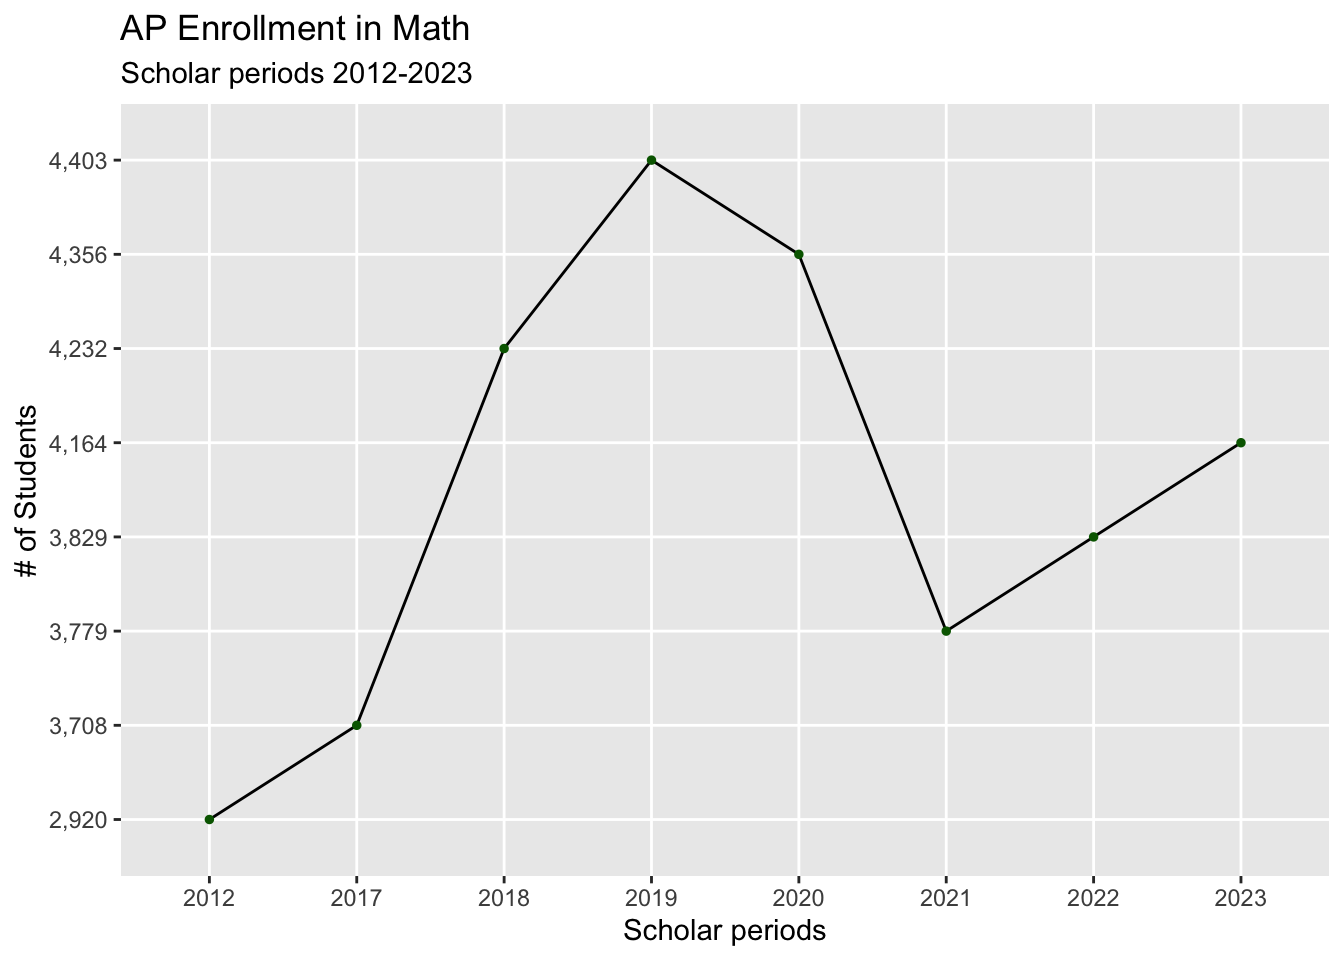
Indicator: Number of students taking STEM-related Advanced Placement tests and average scores
The Iowa annual evaluation reports from 2013-2023 were used for this indicator. We can appreciate a recovery from 2020-2021.
Warning in read.table(file = file, header = header, sep = sep, quote = quote, :
incomplete final line found by readTableHeader on 'Data/iowa_indicator6.csv'