flowchart TD
    A[What are other Midwestern<br>states doing better, in terms<br>of resources and policy,<br>than Iowa in STEM?] --> B[What states are performing<br>better than Iowa?]
    B --> C{Compare the factors and<br>indicators across Midwest}
    C -->|One| D[Unemployment]
    C -->|Two| E[Overall Economy]
    C --> |Three| F[Post Secondary Education]
    C --> |Four| G[Mathematics Scores]

    D --> I{Common States}
    E --> I
    F --> I
    G --> I

    I --> J[What are the resources/policy<br>that these states set up<br>to improve STEM?] --> K[Can these resouces be applied<br>to Iowa?]

linkStyle default stroke: black
Introduction
Our main goals:
- Compare the STEM factors we found the previous week between Iowa and the Midwest
- Compare the STEM education indicators
We decided to focus on narrowing the comparisons to the Midwest because of the similarities between states, and we compared the factors and indicators to identify those states with better metrics than Iowa and understand what these states are doing (policies, resources) .
General process
Limitations
- The STEM education indicators were not available in other Midwest states, so the comparison wasn’t performed for those cases
Findings
Unemployment
          state STEM Employ STEM Unemploy   PCI R&D performance
1      Michigan    97.53862      2.461375 56813           24898
2      Illinois    97.63993      2.360073 68822           19203
3          Ohio    97.91931      2.080694 57880           16647
4       Indiana    97.95426      2.045735 57930           10303
5     Minnesota    98.48507      1.514928 68010           10301
6     Wisconsin    98.67023      1.329768 61210            8346
7      Missouri    98.19492      1.805079 56551            8229
8          Iowa    98.97772      1.022281 58905            4480
9        Kansas    98.53966      1.460338 60152            3616
10     Nebraska    98.42993      1.570071 63321            1492
11 North Dakota    99.03849      0.961513 66184             679
12  Sout Dakota    99.27201      0.727991 65806             344
There is an inverse relationship between GDP and unemployment (Okun’s law). However, Michigan and Ohio have the most significant unemployment rates in STEM; however, they also have the first and third place in Research and Development performance (2022).
Illinois (68822), Minnesota (68010), North Dakota (66184), and South Dakota (658060) have the greatest GDP per capita in the Midwest. Iowa has 58905 (8th place).
There is no clear relationship between GDP, STEM unemployment, and R&D performance, but R&D intensity is the next factor to be investigated.
- a metric that quantifies the level of research and development spending by a company or entity relative to its total assets or revenue
Overall Economy
Motivation
To compare various economic and educational indicators for Iowa versus other North Central Extension states — analyzing how STEM-related factors influence innovation and workforce development.
Education Indicator: ACT Scores in Math and Science
We analyzed ACT Math and Science scores by state for the years 2020–2024. This helps assess STEM readiness among students across Midwestern states.
Source: ACT Official Website
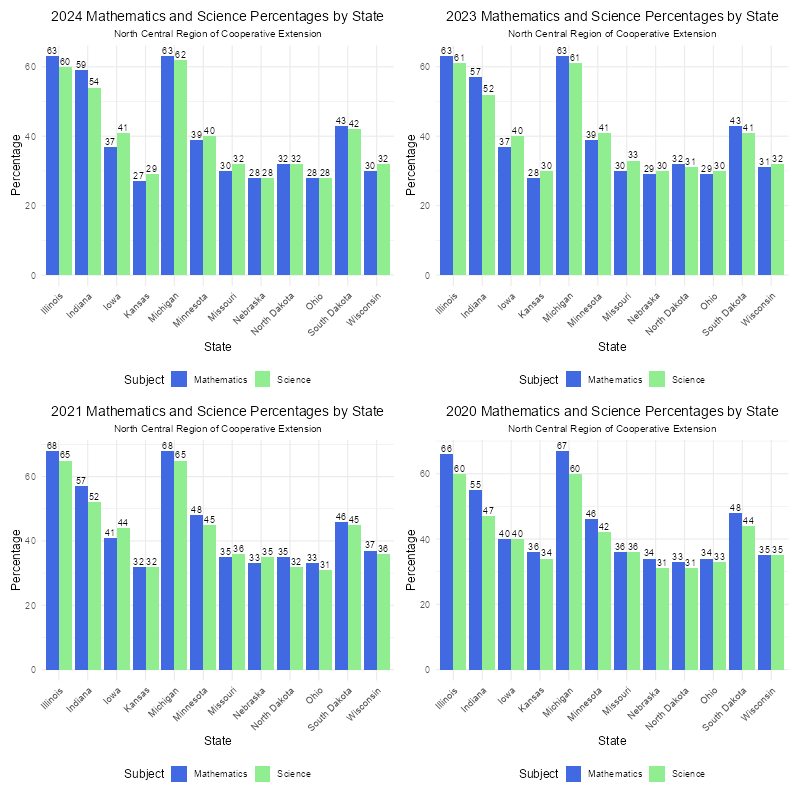
Observations
- Top Performers
- Illinois and Michigan consistently perform above 60% in both math and science — notably higher than other Midwest states.
- Indiana is stable with scores in the mid-to-high 50s, showing less year-to-year volatility.
- Mid to Low Performers
- Iowa, Minnesota, and Ohio hover in the mid-40s to low 50s, showing a general downward trend.
- Wisconsin, Missouri, South Dakota, and Nebraska show a steady decline, dipping below 40% in some years.
- Lowest Performers
- North Dakota and South Dakota are among the lowest, with scores ranging in the low 30s to low 40s.
- Nebraska shows a concerning decline from the mid-30s to below 30% by 2024.
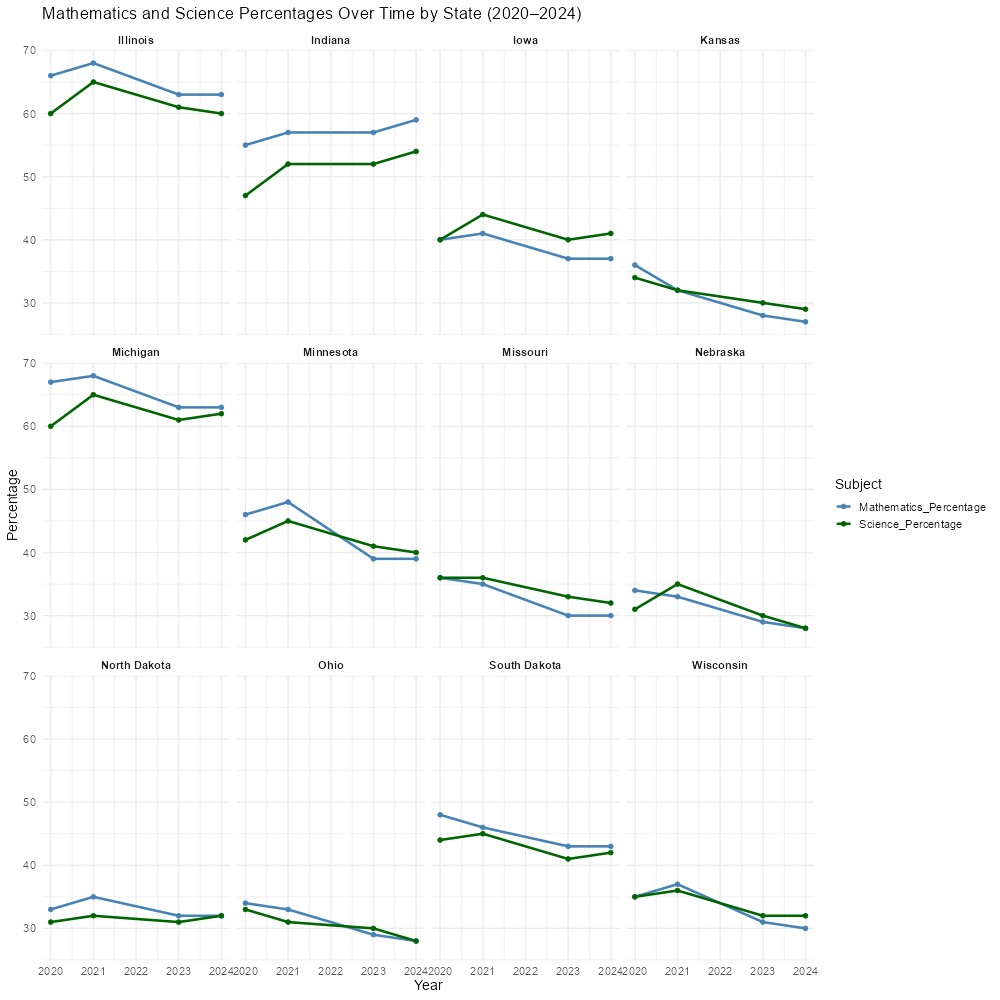
- Shocking Trends
- Nearly every state experienced a drop in ACT scores after 2021, likely due to:
- COVID-19 learning loss
- Reduced test participation
- Test-optional policies lowering motivation
- Minnesota’s drop from ~45% to ~40% is surprising given its strong academic reputation.
- Iowa’s decline is unexpected considering its established K–12 education systems.
- Nearly every state experienced a drop in ACT scores after 2021, likely due to:
Policy & Educational Factors
| State | STEM Education Landscape |
|---|---|
| Illinois | IL STEM Learning Exchanges; strong AP access; urban investment. |
| Michigan | MI STEM Network; Career Pathways; Ford/GM education programs. |
| Iowa | Iowa STEM Council active but may face rural implementation challenges. |
| Nebraska, Dakotas | Lower per-student spending; fewer dual-credit and STEM offerings. |
| Minnesota | Historically strong education system; drop may stem from teacher shortages and curriculum debates. |
Limitation - Data for the year 2022 is missing from the ACT dataset.
Economy: Innovation and Export
1. STEM Employment Data
We began by analyzing the total number of STEM jobs across states. We then compared it with state population to derive STEM employment as a percentage of total population.
STEM Employment by State
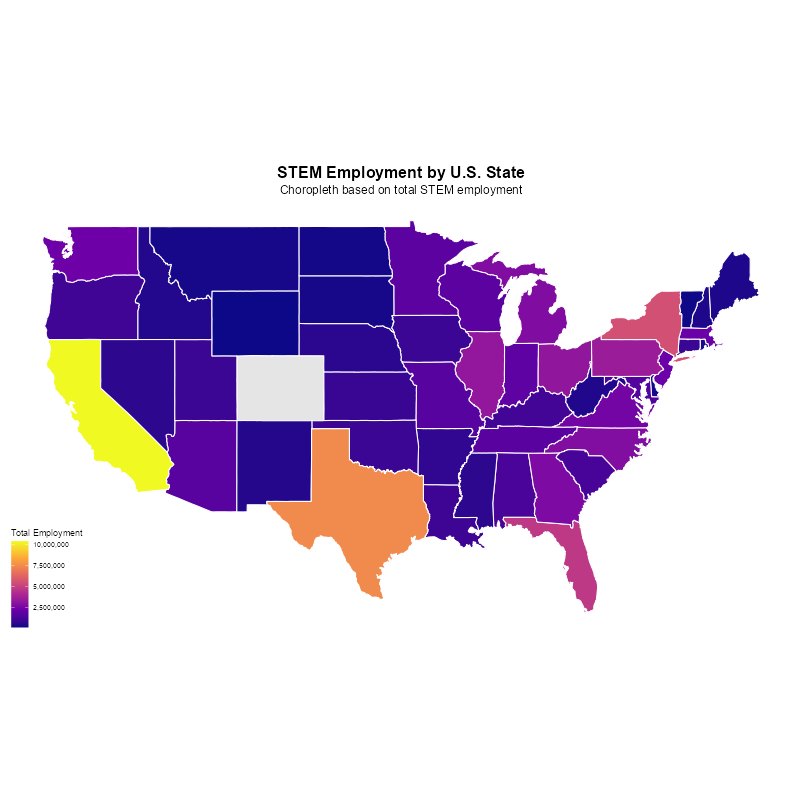
Observations
- California stands out with the highest number of STEM jobs, followed by Texas, New York, and Florida.
- Massachusetts and New Jersey show high employment rates relative to size — emphasizing quality over quantity.
Why California?
- Silicon Valley: Home to Google, Apple, Meta, etc.
- Top Universities: UC Berkeley, Stanford, Caltech.
- R&D Investment: Especially in aerospace and biotech.
- Talent Migration: Attracts skilled international professionals.
Why Texas?
- Major Hubs: Austin, Houston, and Dallas lead in tech.
- STEM Industries: Aerospace, NASA, renewables, and oil R&D.
- Policy Advantages: Business-friendly environment and no state income tax.
- Workforce Supply: Large population means abundant STEM labor.
Limitations
- Colorado — Data is missing. This is notable since Colorado is a known STEM center (e.g., Boulder, Denver).
- Washington appears underrepresented, which is unexpected given its strong STEM base (Amazon, Microsoft, Boeing). This may reflect cutoff dates or STEM job definitions.
2. Business Dynamics: BDS Data
We used Census BDS data to explore trends like firm births, closures, net job creation, and survival rates.
An interactive Shiny app was developed for dynamic exploration:
Observations
- Allows real-time comparison of business dynamics across states and years.
- Can filter by firm size, industry, and age for deeper insights.
- Helpful in linking entrepreneurship trends with STEM readiness and economic resilience.
3. Internet Availability
- Although Internet access is a known driver of innovation, our dataset lacked direct metrics to quantify its impact on economic growth.
- As a result, this factor was not explored further in this iteration.
4. Export Data
- While we have access to state-level export data, it is difficult to directly classify exports as STEM-related, since most data is organized by product type rather than economic sector.
- For consistency, we plan to focus on Midwestern states only in future comparative export analysis.
Post Secondary Education
Motivation
- What level of education is needed to go into STEM?
- What demographic groups are obtaining STEM degrees?
- Are Iowa post-secondary institutions turnings out a proportional amount of STEM graduates compared to other states?
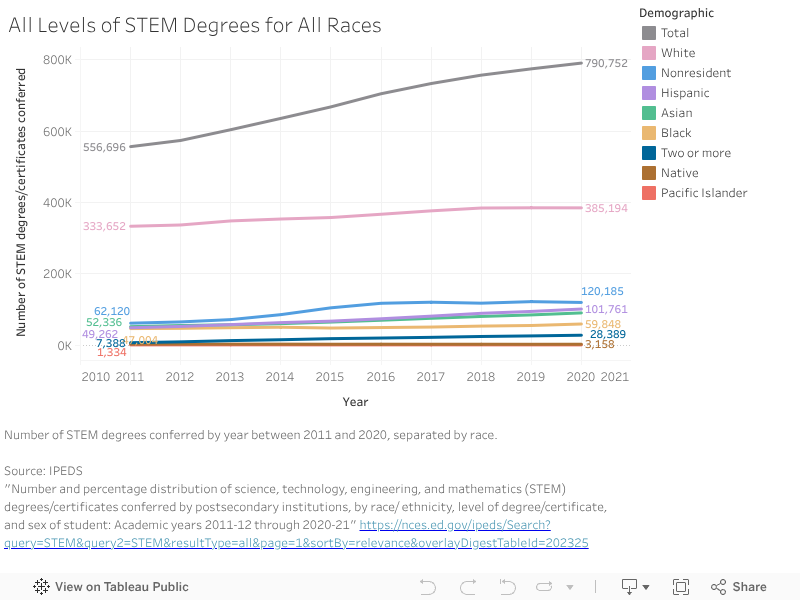
Findings

Observations
- The overall number of STEM degrees conferred is still growing
- Large majority of STEM degrees are Baccalaureate level
- PSEO: graduate degrees aren’t needed as much to obtain jobs for STEM as opposed to non-STEM
- Still, the number of STEM masters degrees being conferred is on the rise. Doctorates are not.
- The number of Associate STEM degrees conferred are going down
- Certificates below Associates being conferred are going up
- Conjecture: In a more competitive job market, more people are obtaining skill certifications in addition to degrees
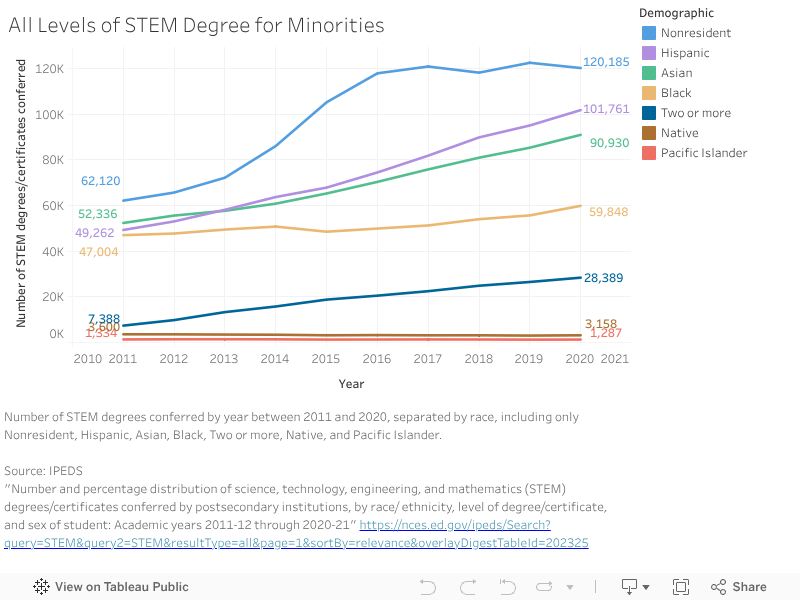
Observations
- The rise in nonresident students who STEM degrees were conferred to went up rapidly, and started to plateau after 2017
- Potential question: What has incentivized nonresident students to get STEM degrees in this time?
- The number of degrees conferred to Hispanic recipients has grown rapidly and steadily

Observations
- 35.3% of degrees conferred in Iowa in 2022 were in science and engineering fields
- Michigan and Wisconsin have the highest proportion of degrees conferred in STEM
- Minnesota had 29.2%, the lowest percent of degreed conferred that were STEM in 2022
- Potential question: Does Iowa have a STEM professionals retainment problem?

Observations
- Michigan increased percent of degreed conferred in STEM by 3.4%
- What is Michigan doing better than the rest?
- Iowa had 3.2% increase, the second highest
- Agricultural sciences
- North and South Dakotas, as well as Minnesota, have seen a decrease in the percent of STEM degrees conferred
Limitations
It was very difficult to find data on the state level.
IPEDS dataset:
- Data includes the 50 states and District of Columbia
- STEM fields include biological and biomedical sciences, computer and information sciences, engineering and engineering technologies, mathematics and statistics, and physical sciences and science technologies
Kansas dataset:
- Degree levels considered in this dataset: bachelor’s, master’s, and doctorate degrees
- Degree fields considered in this dataset: engineering, physical, computer and mathematical, agricultural and biological, and social sciences, science technologies, and engineering technologies
- Some of the fields considered may be controversially STEM and are not included in other datasets but dataset had predetermined it so we cannot make it uniform to the IPEDS
Mathematics Scores
Motivation:
- Although math scores are not a huge indicator to whether a state is doing better in STEM, since they don’t impact the STEM field directly, especially with such a young group, they do somewhat show a trend of whether students are interested in STEM.
NAEP scores for 4th graders
NAEP scores for 8th graders
Findings:
- Iowa, since 2019, seems to be on a downwards trend for both 4th and 8th graders.
- These trends are similar with other states around the Midwest as well.
- One possible reason:
- No quality education for a year (due to COVID)
- However, some states began recovering in 2022
- What are these states doing that helps improve their scores?
- Can Iowa implement this as well?
- To find said states, look at percentage change from 2022 to 2024
Percent Change in 4th grade NAEP scores (2022 to 2024)

Percent Change in 8th grade NAEP scores (2022 to 2024)

Conclusion:
- Iowa has regressed for both 4th and 8th graders
- Indiana, Ohio and Kansas seem to be on an upwards trend
- Look into policies and resources that these states are incorporating?
Limitations:
- NAEP scores only limited to three years: 2019, 2022, 2024
- Skipping 2021 due to COVID
- Deeper analysis can include more categories (ex. Proficient or Above, Advanced only, etc)
Common States
- Each indicator had a different state performing better than other states
- Two states that were commonly seen:
- Indiana
- Ohio
- What are these states implementing that is working?
Policy
- Indiana
- K–12 Robotics Grants
- Dedicated funding for hands-on robotics & coding.
- Up to $100,000 in grant funding
- Iowa has no specfic funding allocated for robotics
- K–12 Robotics Grants
- Ohio
- OSLN Classroom Grants
- Up to $5K per teacher for STEM innovation (direct, flexible classroom support).
- So far 300 projects have been awarded up
- Iowa lacks statewide grant programs direct to teachers
- OSLN Classroom Grants
Next Steps
- Find out the migration patterns of STEM professionals (Bachelor’s degree) in and out of Iowa
- ACS dataset
- Can explore this by first:
- Creating a PolicyMap database with information from the Bureau of Economic Analysis
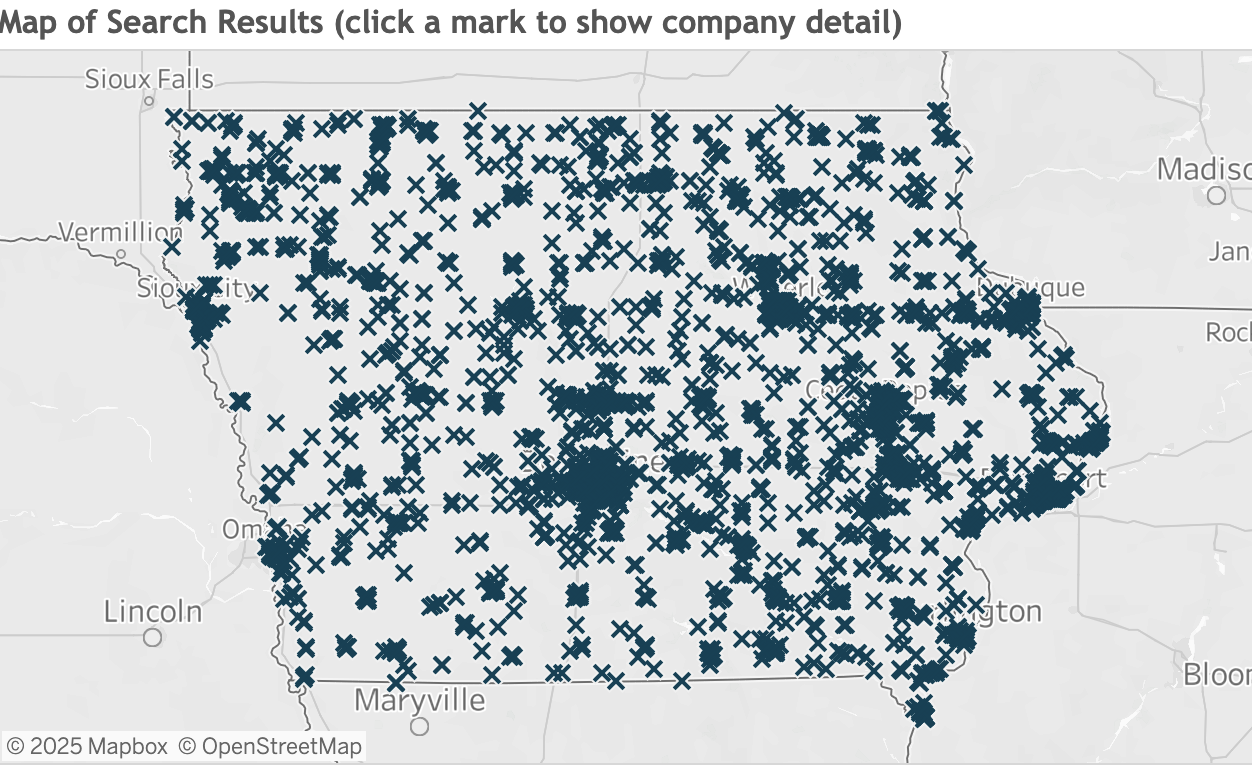
- Another path to pursue:
- Creating a Resources Map with information about companies, community colleges, and universities in Iowa. Example: