Acknowledgments
We want to thank Sara Nelson (STEM State lead, ISU faculty), Tanya Hunt (Iowa STEM Council), Betsy Lundy (Iowa Department of Education), and Namrata Vaswany ( CyMath Director, ISU faculty) for their invaluable contribution with contacts, data, and insights that helped our project.
Introduction
Science, Technology, Engineering, and Mathematics (STEM) education prepares students for future careers and drives national economic growth. In 2023, STEM occupations contributed 39.2% of the US Gross Domestic Product (ScienceisUS, 2025).
Iowa’s annual growth rate for 2022-2032 is around 0.6% (Iowa Workforce Development, n.d.). Non-STEM occupations have an estimated growth of 0.5%, but STEM occupations have an estimated average growth of 1.28%. Additionally, STEM businesses in Iowa grow at a higher rate than non-STEM businesses:

This emphasises the rapid expansion of STEM industries and highlights the need for greater attention and support. Additional reasons to prioritize STEM in Iowa include job creation, projected growth, unemployment, etc.
However, the governor of Iowa has noted that many companies struggle to find qualified workers with the necessary skills. In response, the state has introduced several initiatives to strengthen STEM education, like the STEM Scale-Up Program , STEM BEST® Program and STEM Teacher Externships Program among others.
Motivation
Despite the recognized importance of a STEM workforce for Iowa economic growth and the initiatives to promote it at K-12, there remains a lack of comprehensive and actionable data on the availability and distribution of STEM resources within Iowa communities. Additionally, a deeper understanding of the factors impacting STEM education in Iowa is needed.
Research questions
Our project aimed to analyze the STEM situation in Iowa from the perspective of the K-12 schools, colleges, and the workforce to answer the following questions:
- Which STEM workforce resources already exist in Iowa (both those in active use and those that remain untapped)?
- Where are these resources located, and how can they be used to support entrepreneurship in STEM?
- What are the factors impacting Iowa STEM education?
- What is the relationship between education and the workforce in Iowa?
What is STEM?
Everyone from researchers to employers can define STEM differently. Because of that, US institutions have created systems to classify what “counts” as STEM. The systems we used include:
- ONET Occupation Codes (OCC) – US Department of Labor
- North American Industry Classification System (NAICS) – used by businesses and government agencies (like the US Census Bureau)
- Classification of Instructional Programs (CIP) – used by the National Center for Education Statistics and the Department of Homeland Security.
Moreover, the codes have also changed over time . In the case of the industries, NAICS codes don’t classify the sub-industries or their activities as STEM, so we manually classify each sub-industry as STEM if at least one encompassed activity is STEM-related. Working with these systems was one of our key limitations because we had to be mindful of how we interpreted “STEM” in each context, in a period, and that by classifying whole sub-industries as STEM, we might include non-related STEM activities that affect our analysis.
Approach
The flowchart below outlines our approach to answering the research questions above: 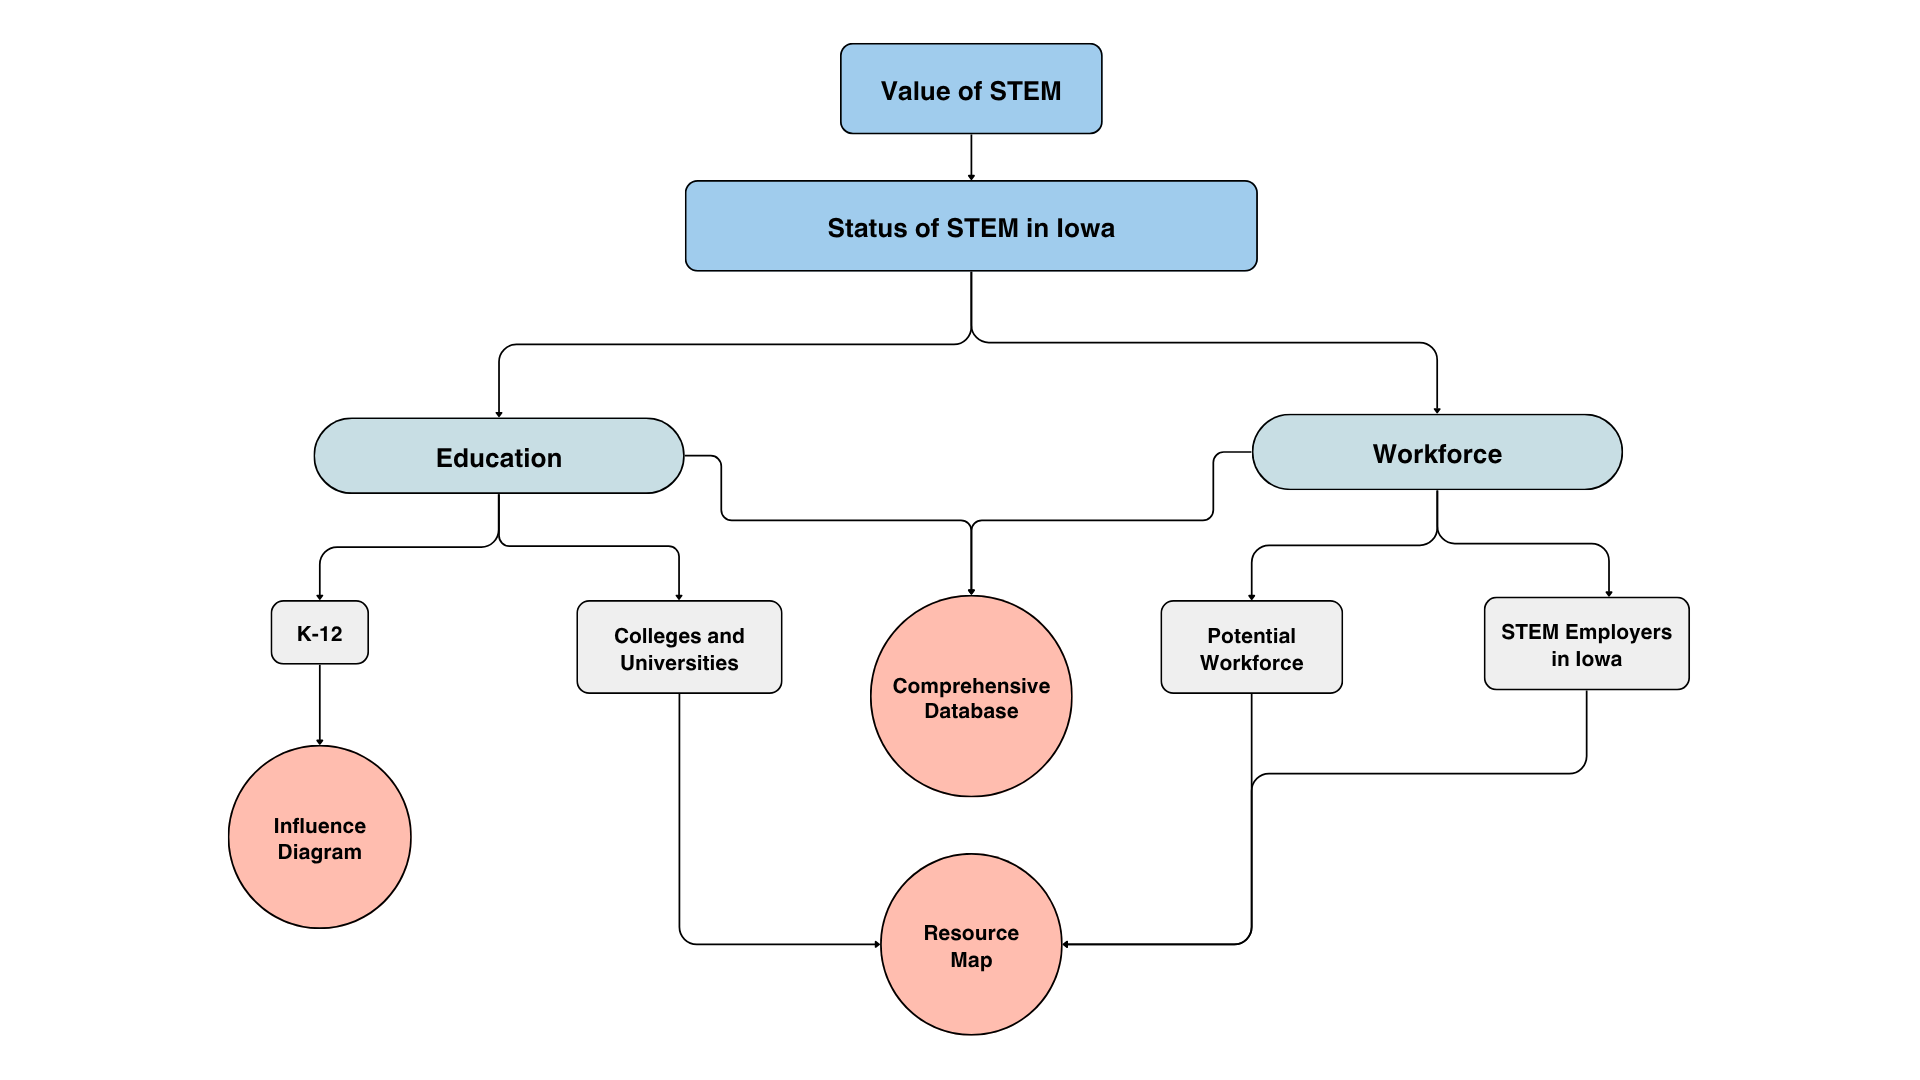
Findings
STEM Education
K-12
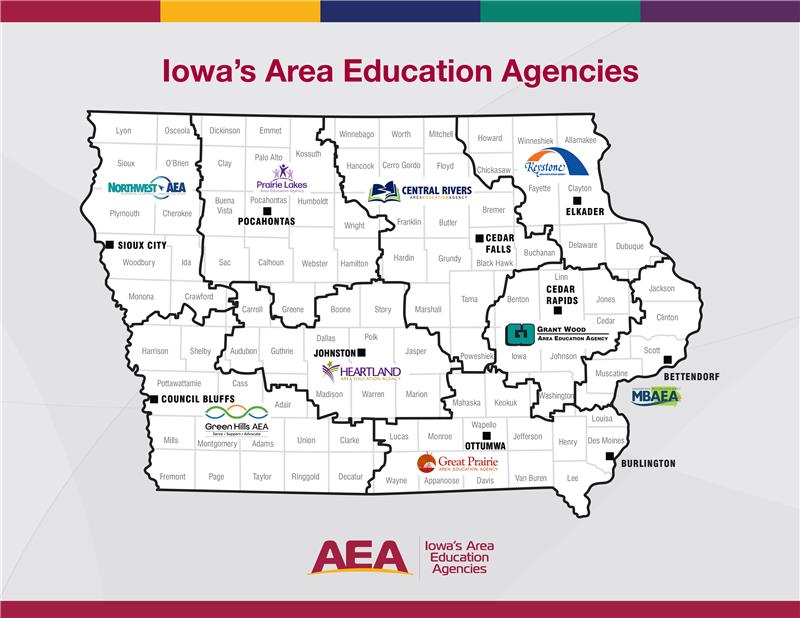
Iowa Area Education Agencies (AEA)
Schools Transitioning from “Average” or above to “Needing help” or “Priority” Statuses
- Data was acquired from the Iowa School Performance Profiles (ISPP) report.
- The map is divded by Area Education Agencies (AEA), which are eduational services areas that provide support for schools and schools district within the region.
- It displays the number of schools in each region that have shifted from an average or above rating to a “Needing Help” or “Priority” status from 2022 to 2023
- These ratings are determined based on multiple factors, including math and science performance, student growth, graduation rates, college readiness, attendance, and English language development.
- Notably, in total, 351 schools have experienced a decline in status.
- Since math and science scores are key components of the ratings, this decline presents insights into the current state of STEM education across the state.
- To further analyze STEM education, we can compare Iowa’s performance to that of other Midwestern states through the National Assessment of Educational Progress (NAEP)
Percent Change in 4th grade NAEP Math scores (2022-2024)
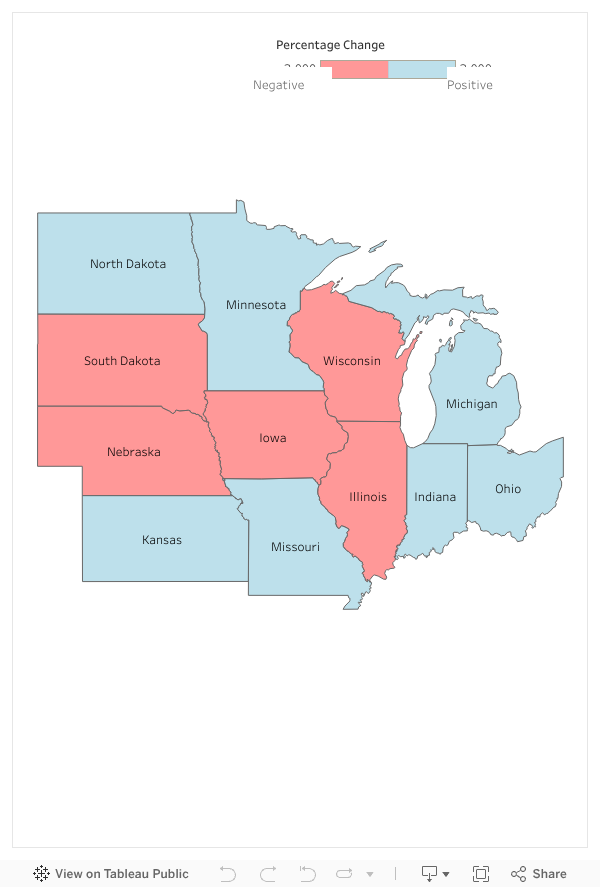
Percent Change in 8th grade NAEP Math scores (2022-2024)
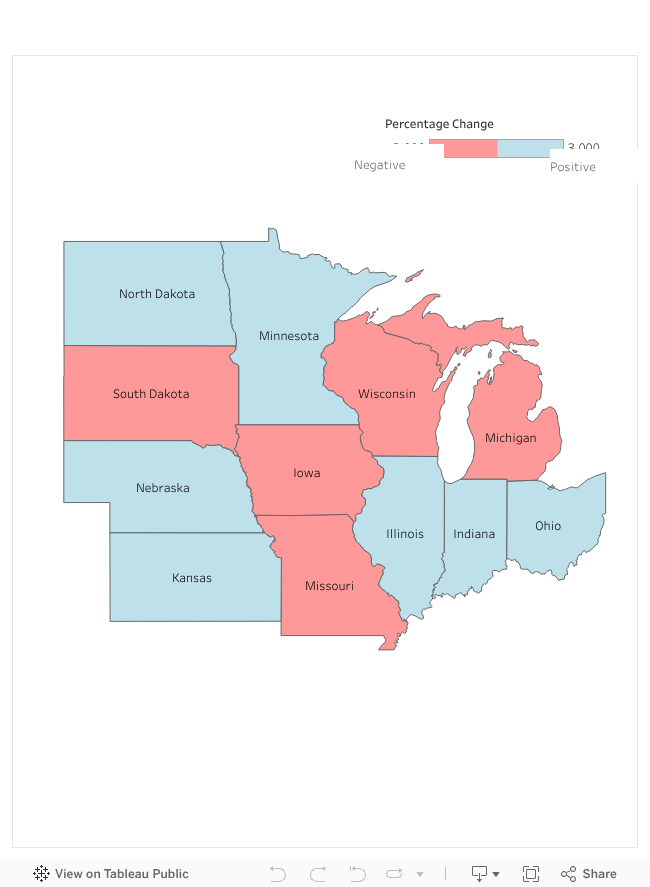
- NAEP Math scores from the National Center for Education Statistics (NCES) were used for analysis.
- Iowa has shown a decline in math performance among both 4th and 8th grade students.
- In contrast, some Midwestern states are outperforming their regional peers.
- Indiana and Ohio, in particular, stand out for their stronger performance.
- This raises the question: What strategies or policies are contributing to their success in improving math scores that Iowa could potentially implement?
Policies
- Indiana
- K–12 Robotics Grants
- Dedicated funding for hands-on robotics & coding.
- Up to $100,000 in grant funding
- Iowa has no specific funding for robotics, but some BEST program partnerships with local industries involve robots and drones.
- K–12 Robotics Grants
- Ohio
- Ohio STEM Learning Network Classroom Grants
- Up to $5K per teacher for STEM innovation (direct, flexible classroom support).
- So far 300 projects have been awarded up
- Iowa doesn’t offer a classroom-specific grant
- Ohio STEM Learning Network Classroom Grants
Let’s take a closer look at Iowa to explore regional differences in STEM performance and determine which school levels may require greater focus.
ISASP Math and Science Proficiency Rate (K-12)
- Data is acquired from the ISPP report
- When examining regional differences, some areas perform worse than others in specific grades. However, no single region consistently underperforms across all indicators, and overall proficiency rates appear relatively consistent across the state.
- While 5th grade science proficiency is low, the data shows that 10th grade proficiency rates in both math and science consistently underperform across the state.
- To understand the potential causes, we need to examine regional areas further and compare low-performing schools with those that are excelling to identify key differences.
To get a better perspective, instead of looking at the ISASP test, which uses a statewide benchmark, we will look at the ACT scores. ACT and ISASP scores are also correlated (Welch et al., 2023), making it a valuable additional metric.
Percent of Students Meeting ACT Benchmarks
- Data is acquired from the ISPP report
- This map illustrates the percent of students meeting ACT benchmark in a school:
- 21/36 for Math
- 23/36 for Science
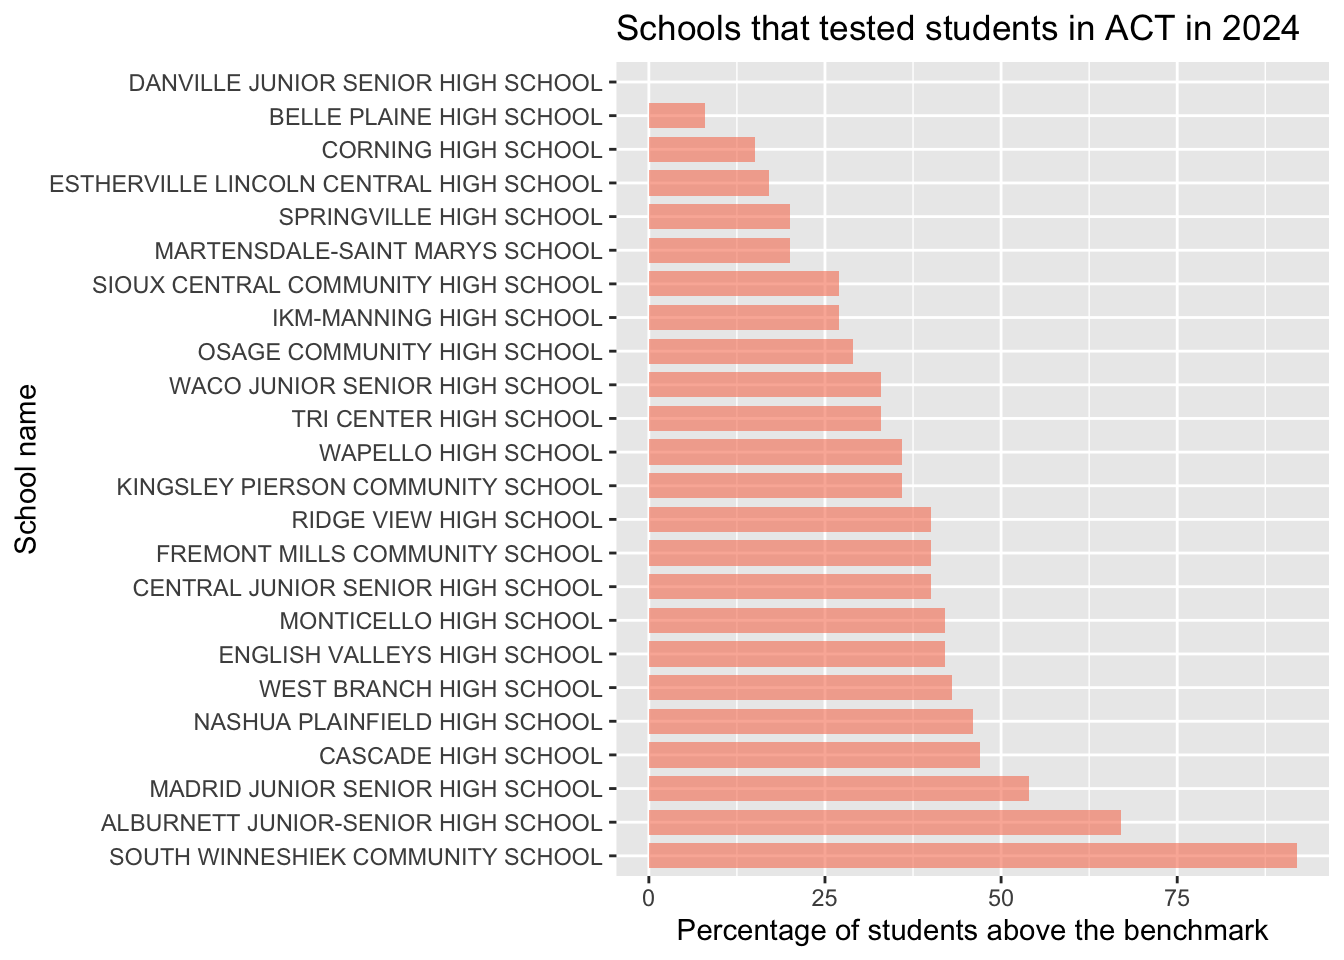
- A notable observation is that South Winneshiek Community School is the top-performing institution in mathematics and science ACT scores . We analyzed the school and found that in 2024, only 13 students were tested; in contrast, East High School, one of the lower performers, tested 58 students. However, we compared with other schools that tested several students in a range of (11,15), and found that South Winneshiek Community School still outperformed those other schools, as shown in the following graph. Further investigation is required about what the school is doing regarding teaching methods and curriculum.
- Additionally, there appear to be clusters of underperforming schools. To identify the most significant of these clusters, a heat map can be used.
- Clusters of underperforming schools tend to be located in urban areas.
- This raises an important question: what are rural schools doing differently that leads to better performance compared to urban schools?
We hypothesized two reasons:
- Funding
- Student to teacher ratio
To explore this question further, we aimed to compare the average funding and student-to-teacher ratios between rural and urban schools. However, we encountered a roadblock: the available data on funding and student-to-teacher ratios is reported at the district level, not at the individual school level. Determining whether school-level data exists will require additional research. This presents an opportunity for future work to investigate what factors, if any, contribute to rural schools outperforming their urban counterparts in STEM.
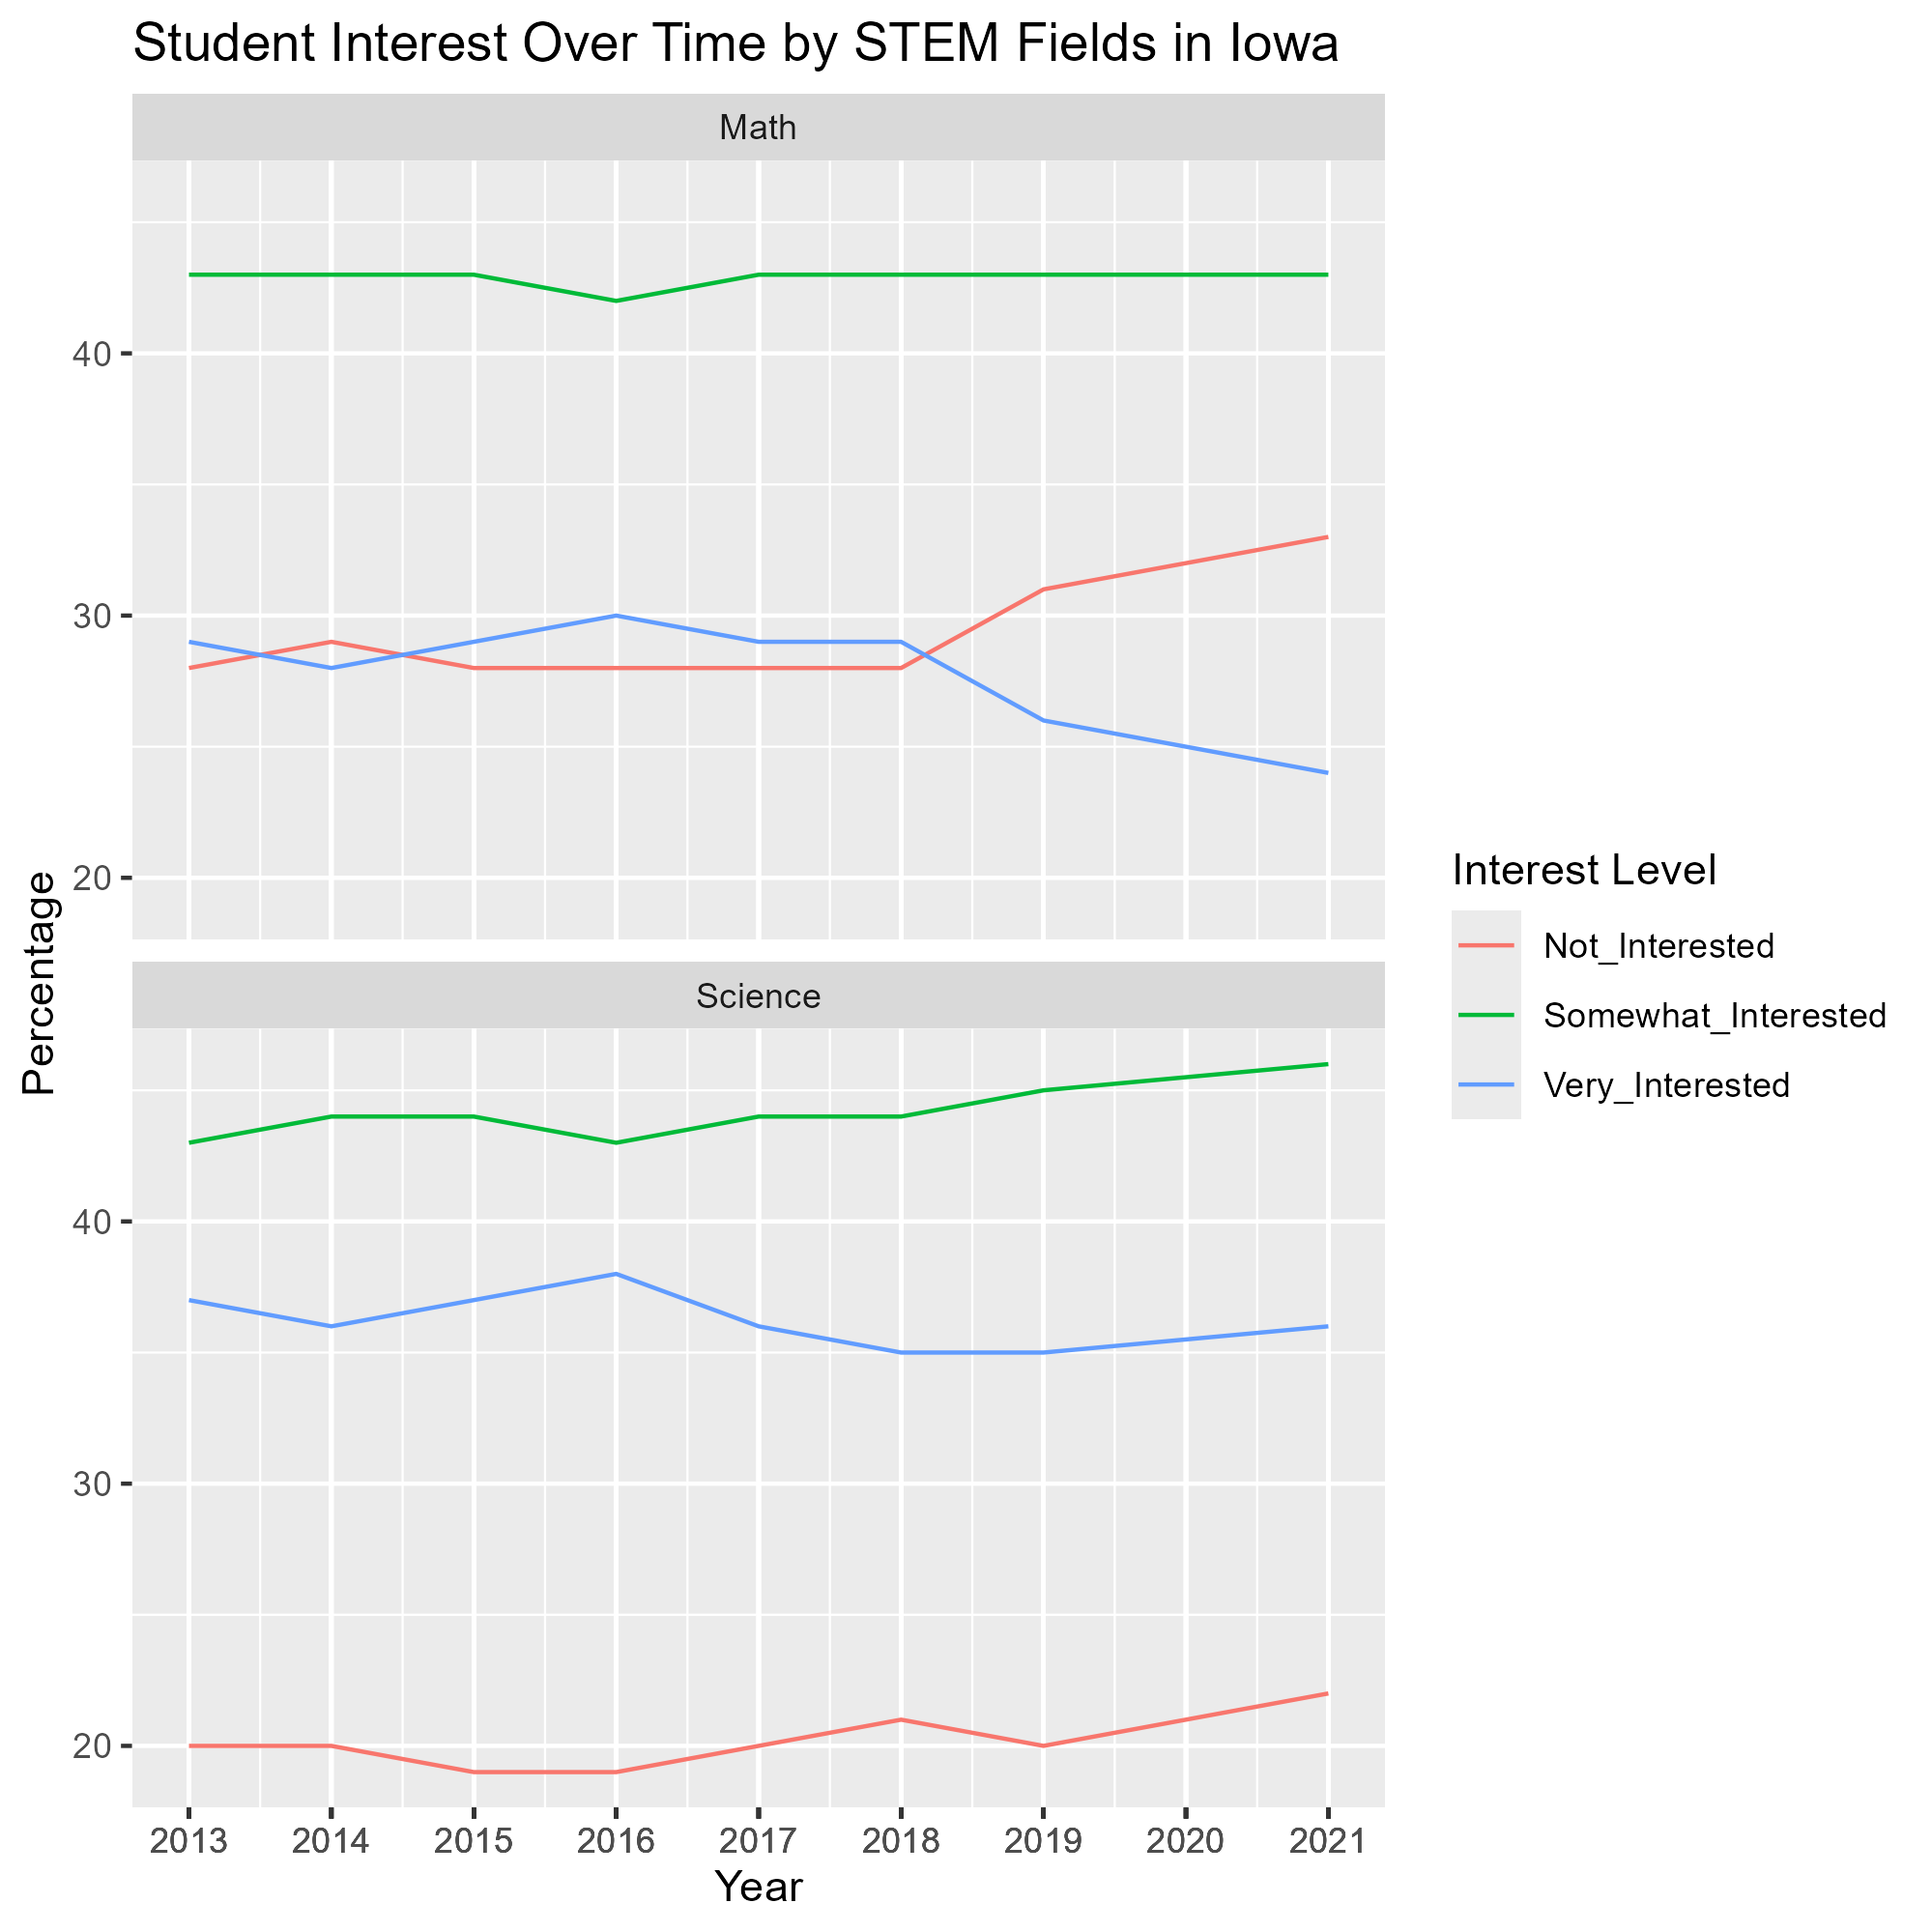
Overall, it seems that ISASP and ACT scores are on an decline, which could be contributed to the low student interest shown in the graph below.
There are likely multiple other factors contributing to this decline, many of which are already captured in our database. However, analyzing these variables will require significant time and effort due to the complexity and volume of data involved. That said, the findings point to opportunities for improvement and growth—particularly in strengthening the development of Iowa’s emerging STEM workforce. Now that we have explored the state of STEM education at the K–12 level, the next question is: what is the current status of STEM education at the college level?
University and community college degrees

Observations:
- The most STEM degrees conferred are baccalaureate by a large margin
- Less people are recieving associates degrees but more are recieving certificates (and other)
- Potential reason: a competitive job market requires higher skills + more niche training
- Number of Masters degrees in STEM increased rapidly in 2013-2016
- STEM doctorate degrees remain unpopular
- Question: Could STEM careers be more accessible?

Observations:
Top 3 in 2022:
- Wisconsin - 38.20%
- Michigan - 38.10%
- Iowa - 35.30%
- There has been a rise in popularity of STEM degrees in Iowa since 2017
- Only 32.00% of degrees in Illinois and 29.20% in Minnesota were STEM in 2022
Although it might seem that Iowa is only performing well because of agricultural sciences, the U.S. News & World Report ranking of best U.S. universities for agricultural sciences shows us that other Midwest states also have good agricultural programs. The ranking rates Purdue University (Indiana) and Michigan State University as outperforming Iowa State University (ISU) in agriculture. The 4 universities immediately following ISU in the ranking are also in the Midwest (Wisconsin, Illinois, Ohio, and Minnesota). Despite that, only Michigan has a higher percentage of growth in S&E degrees conferred which indicates that agricultural sciences may not be the only reason Iowa is performing well.
What are people doing with those STEM degrees?
Workforce
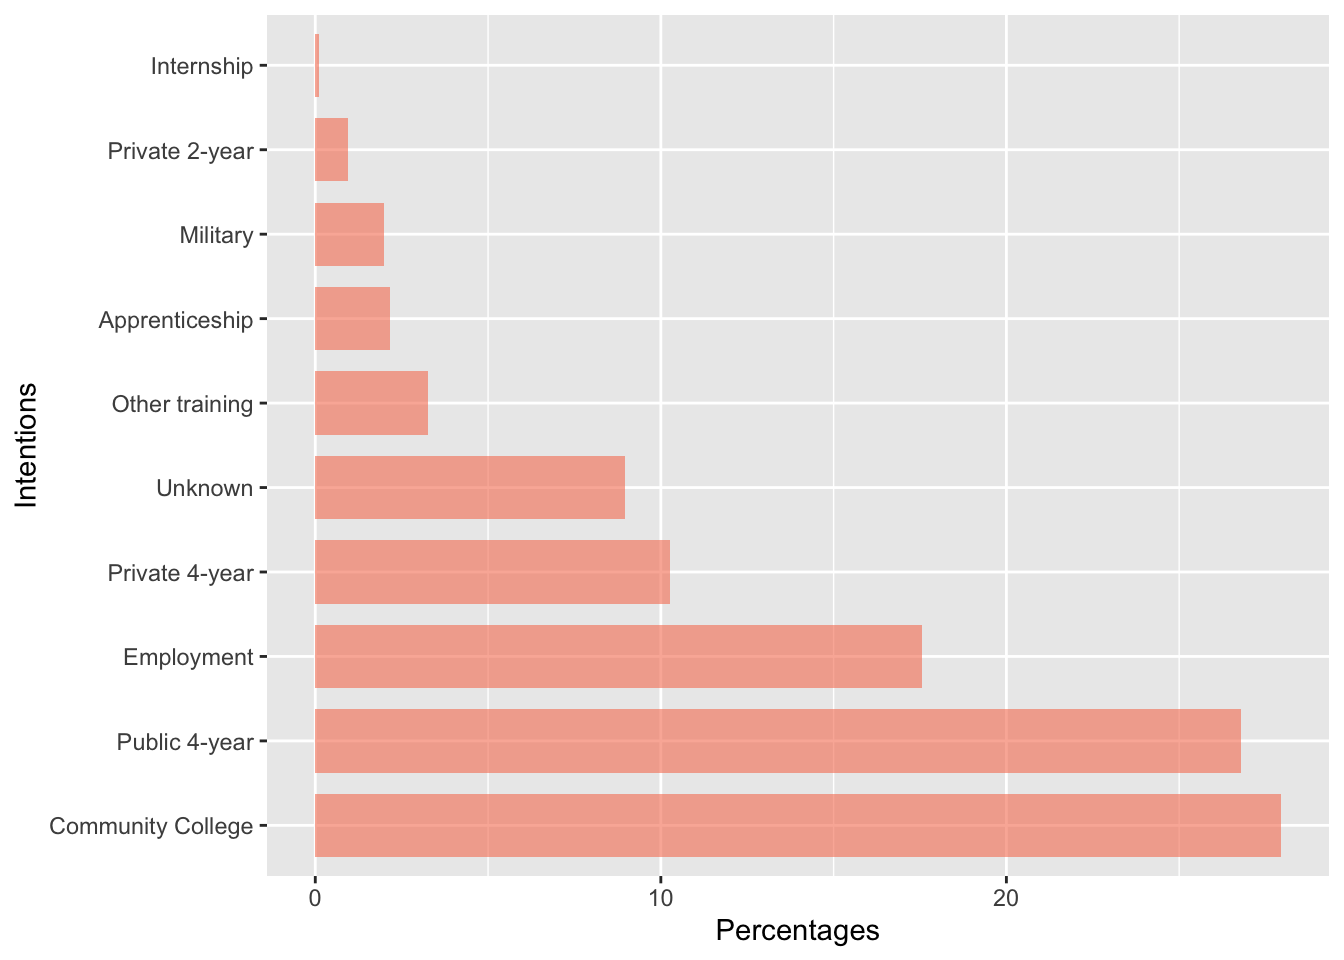
High School graduate intentions for 2023-2024
Wages
Do degrees — especially in STEM — lead to better earnings?
A recent study found that “A little over half of STEM workers do not have a bachelor’s degree”. (Science and Engineering indicators, NCSES (National Center for Science and Engineering Statistics))
So, we examined average wage distribution for those with and without a Bachelor’s degree in both STEM and non-STEM categories.
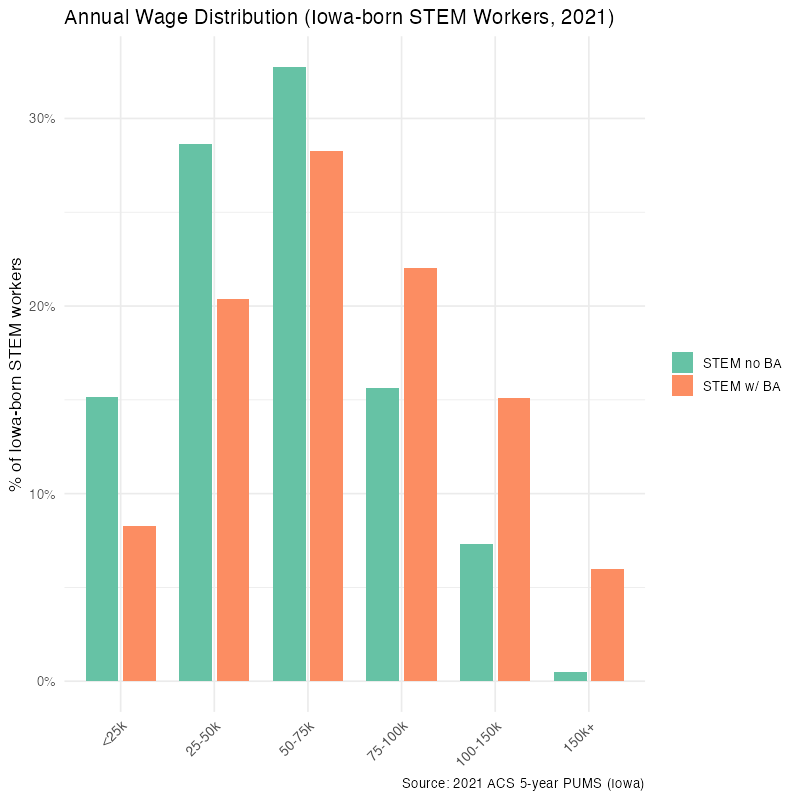
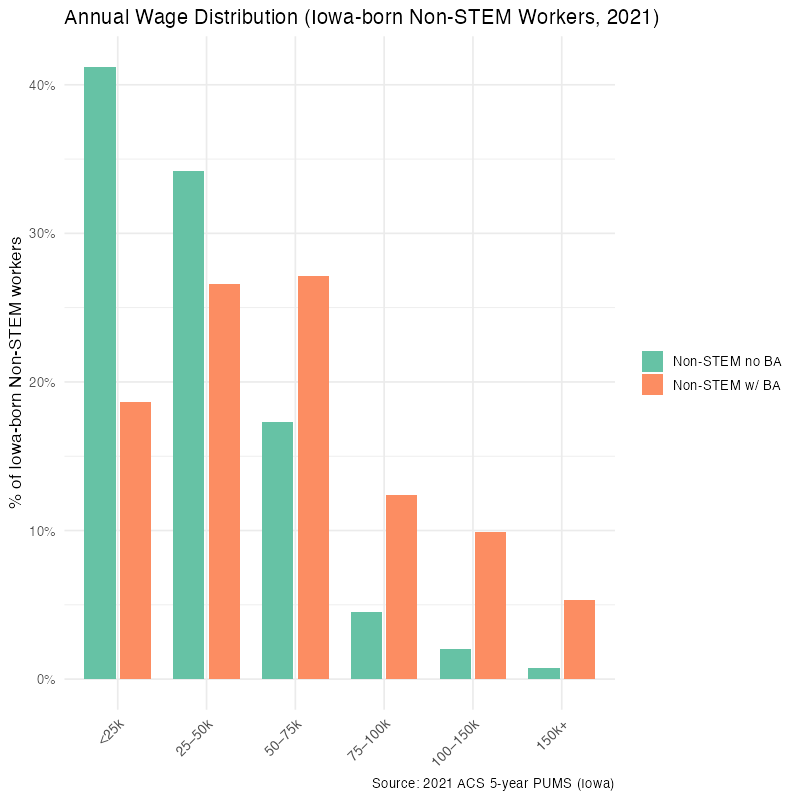
Observations
- Higher wages are more common in STEM
- A much larger percentage of STEM workers with a Bachelor’s earn in the $75K–150K range compared to non-STEM.
- From $25K–100K we see that STEM workers without a Bachelor’s earn more than Non_STEM with a bachelors.
- Higher education boosts wages in both STEM and non-STEM fields, though livable incomes are still possible without a bachelor’s degree, especially in STEM.
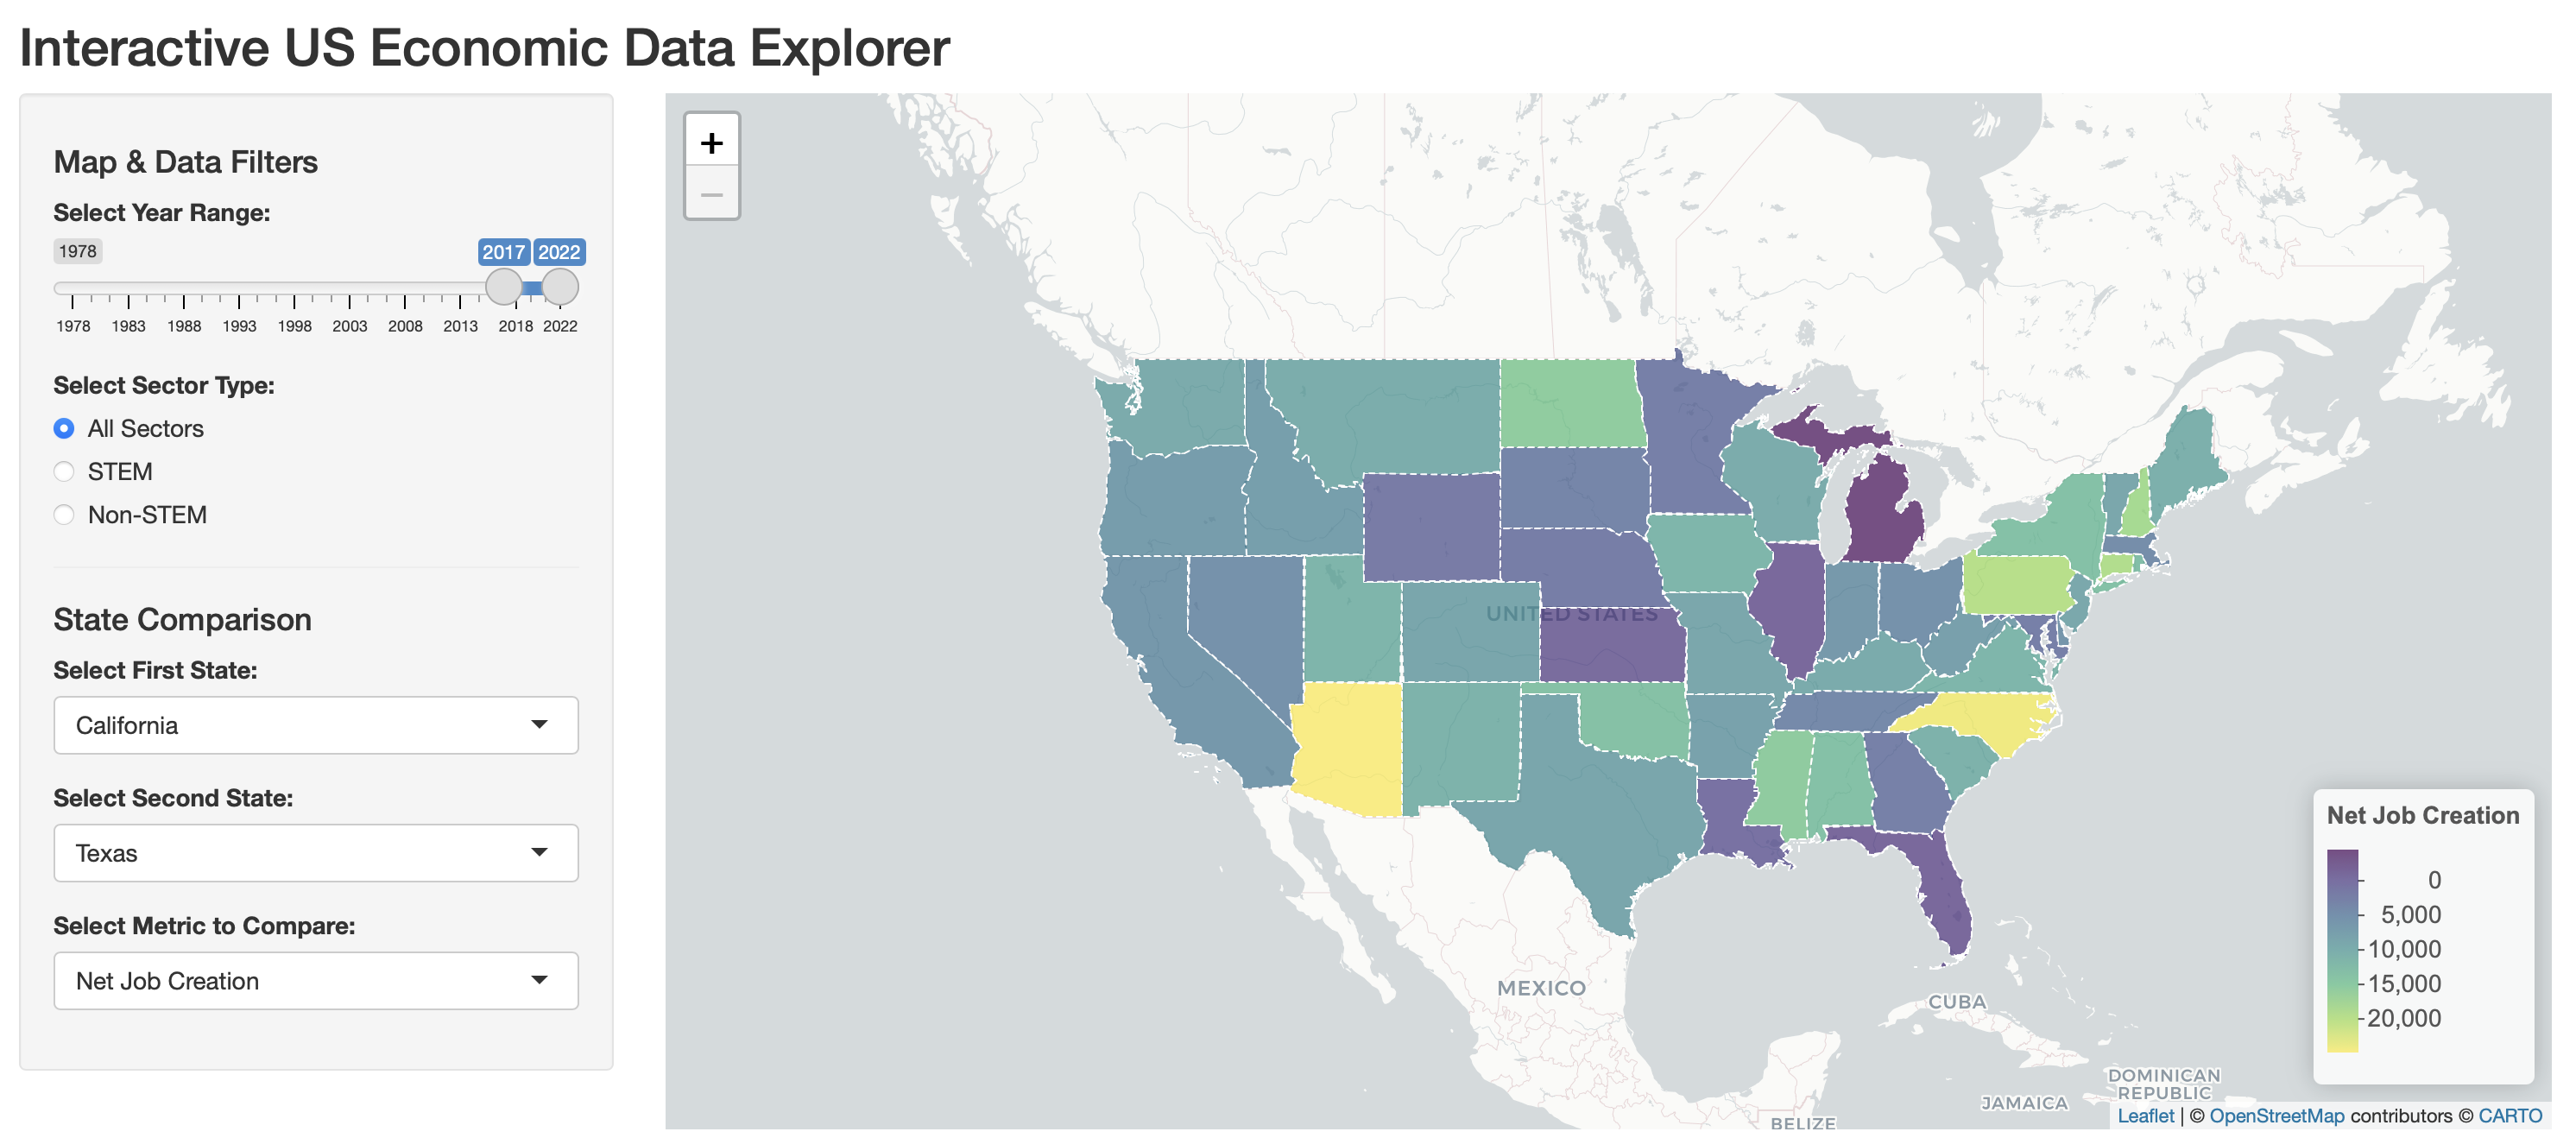
Net job creation
STEM migration
Why Is STEM Talent Leaving Iowa?
Our analysis reveals a striking pattern: a significant portion of Iowa-born, highly educated individuals are leaving the state for STEM jobs elsewhere. Iowa currently has a population of 3.24 million, and over 1.3 million Iowa-born individuals have at least a bachelor’s degree and work in STEM fields. Surprisingly, more than 690,000 of them no longer reside in Iowa.
States like Minnesota (home to over 35,000 Iowa-born STEM workers) and other nearby Midwestern states are top destinations. Iowa is known for its strong education policies, attracting students from across the Midwest — but once they graduate, many take their talent elsewhere.
This migration poses a challenge but also an opportunity. Iowa already has the foundation for growth: a skilled workforce, available land, strong education, and designated opportunity zones. With the right investments and policies, we have the potential not just to retain talent — but to become a hub for innovation and stem driven growth!
Project deliverables
In addition to answer our research questions, we aimed to provide actionable data to Iowa STEM stakeholders from the academy, the industry, and the government in the form of:
- An Influence Diagram that shows the variables that might impact a K-12 student’s interest and decision to enroll in a STEM career.
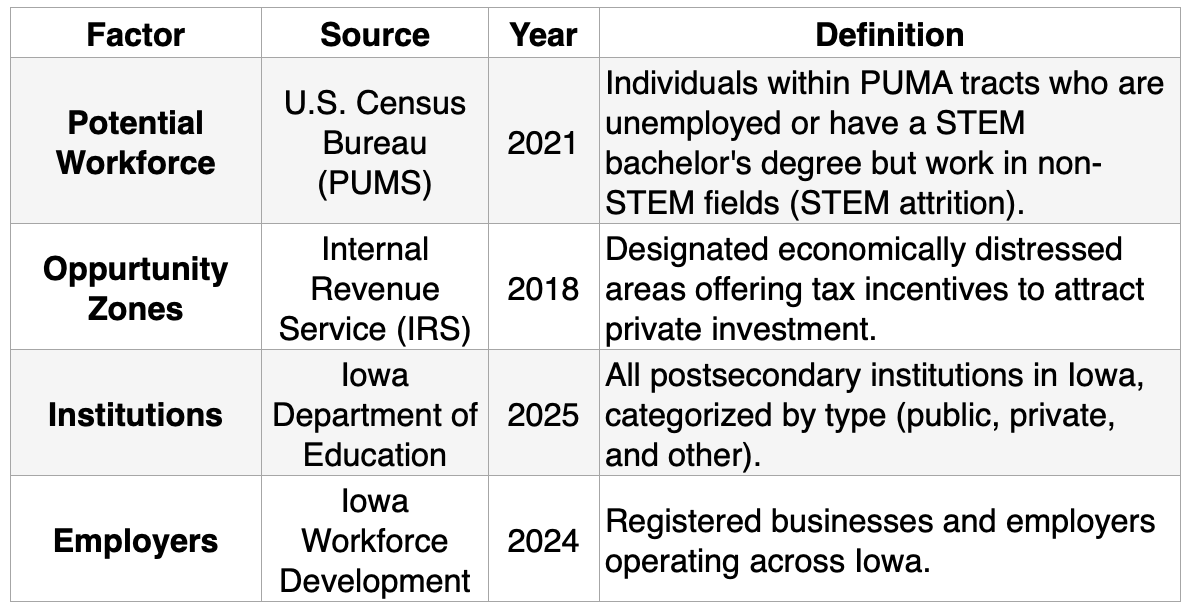
- An Iowa map that shows STEM resources available (schools, companies, IRS zones of interest, workforce density, and untapped workforce) combined.
- A uniform datasource that connects and relates public data from the Iowa Department of Education, US Census, US Department of Labor, Iowa Workforce Development, and the National Science Foundation.
Influence Diagram
The following diagram represents an integrated model synthesized from three scholarly studies employing Structural Equation Modeling (Amalina et al., 2025; Wang, 2012) and Path Analysis (Sellami et al., 2017). This model explores the multidimensional factors contributing to students’ interest in STEM careers and their entry into STEM fields.

STEM Resources map
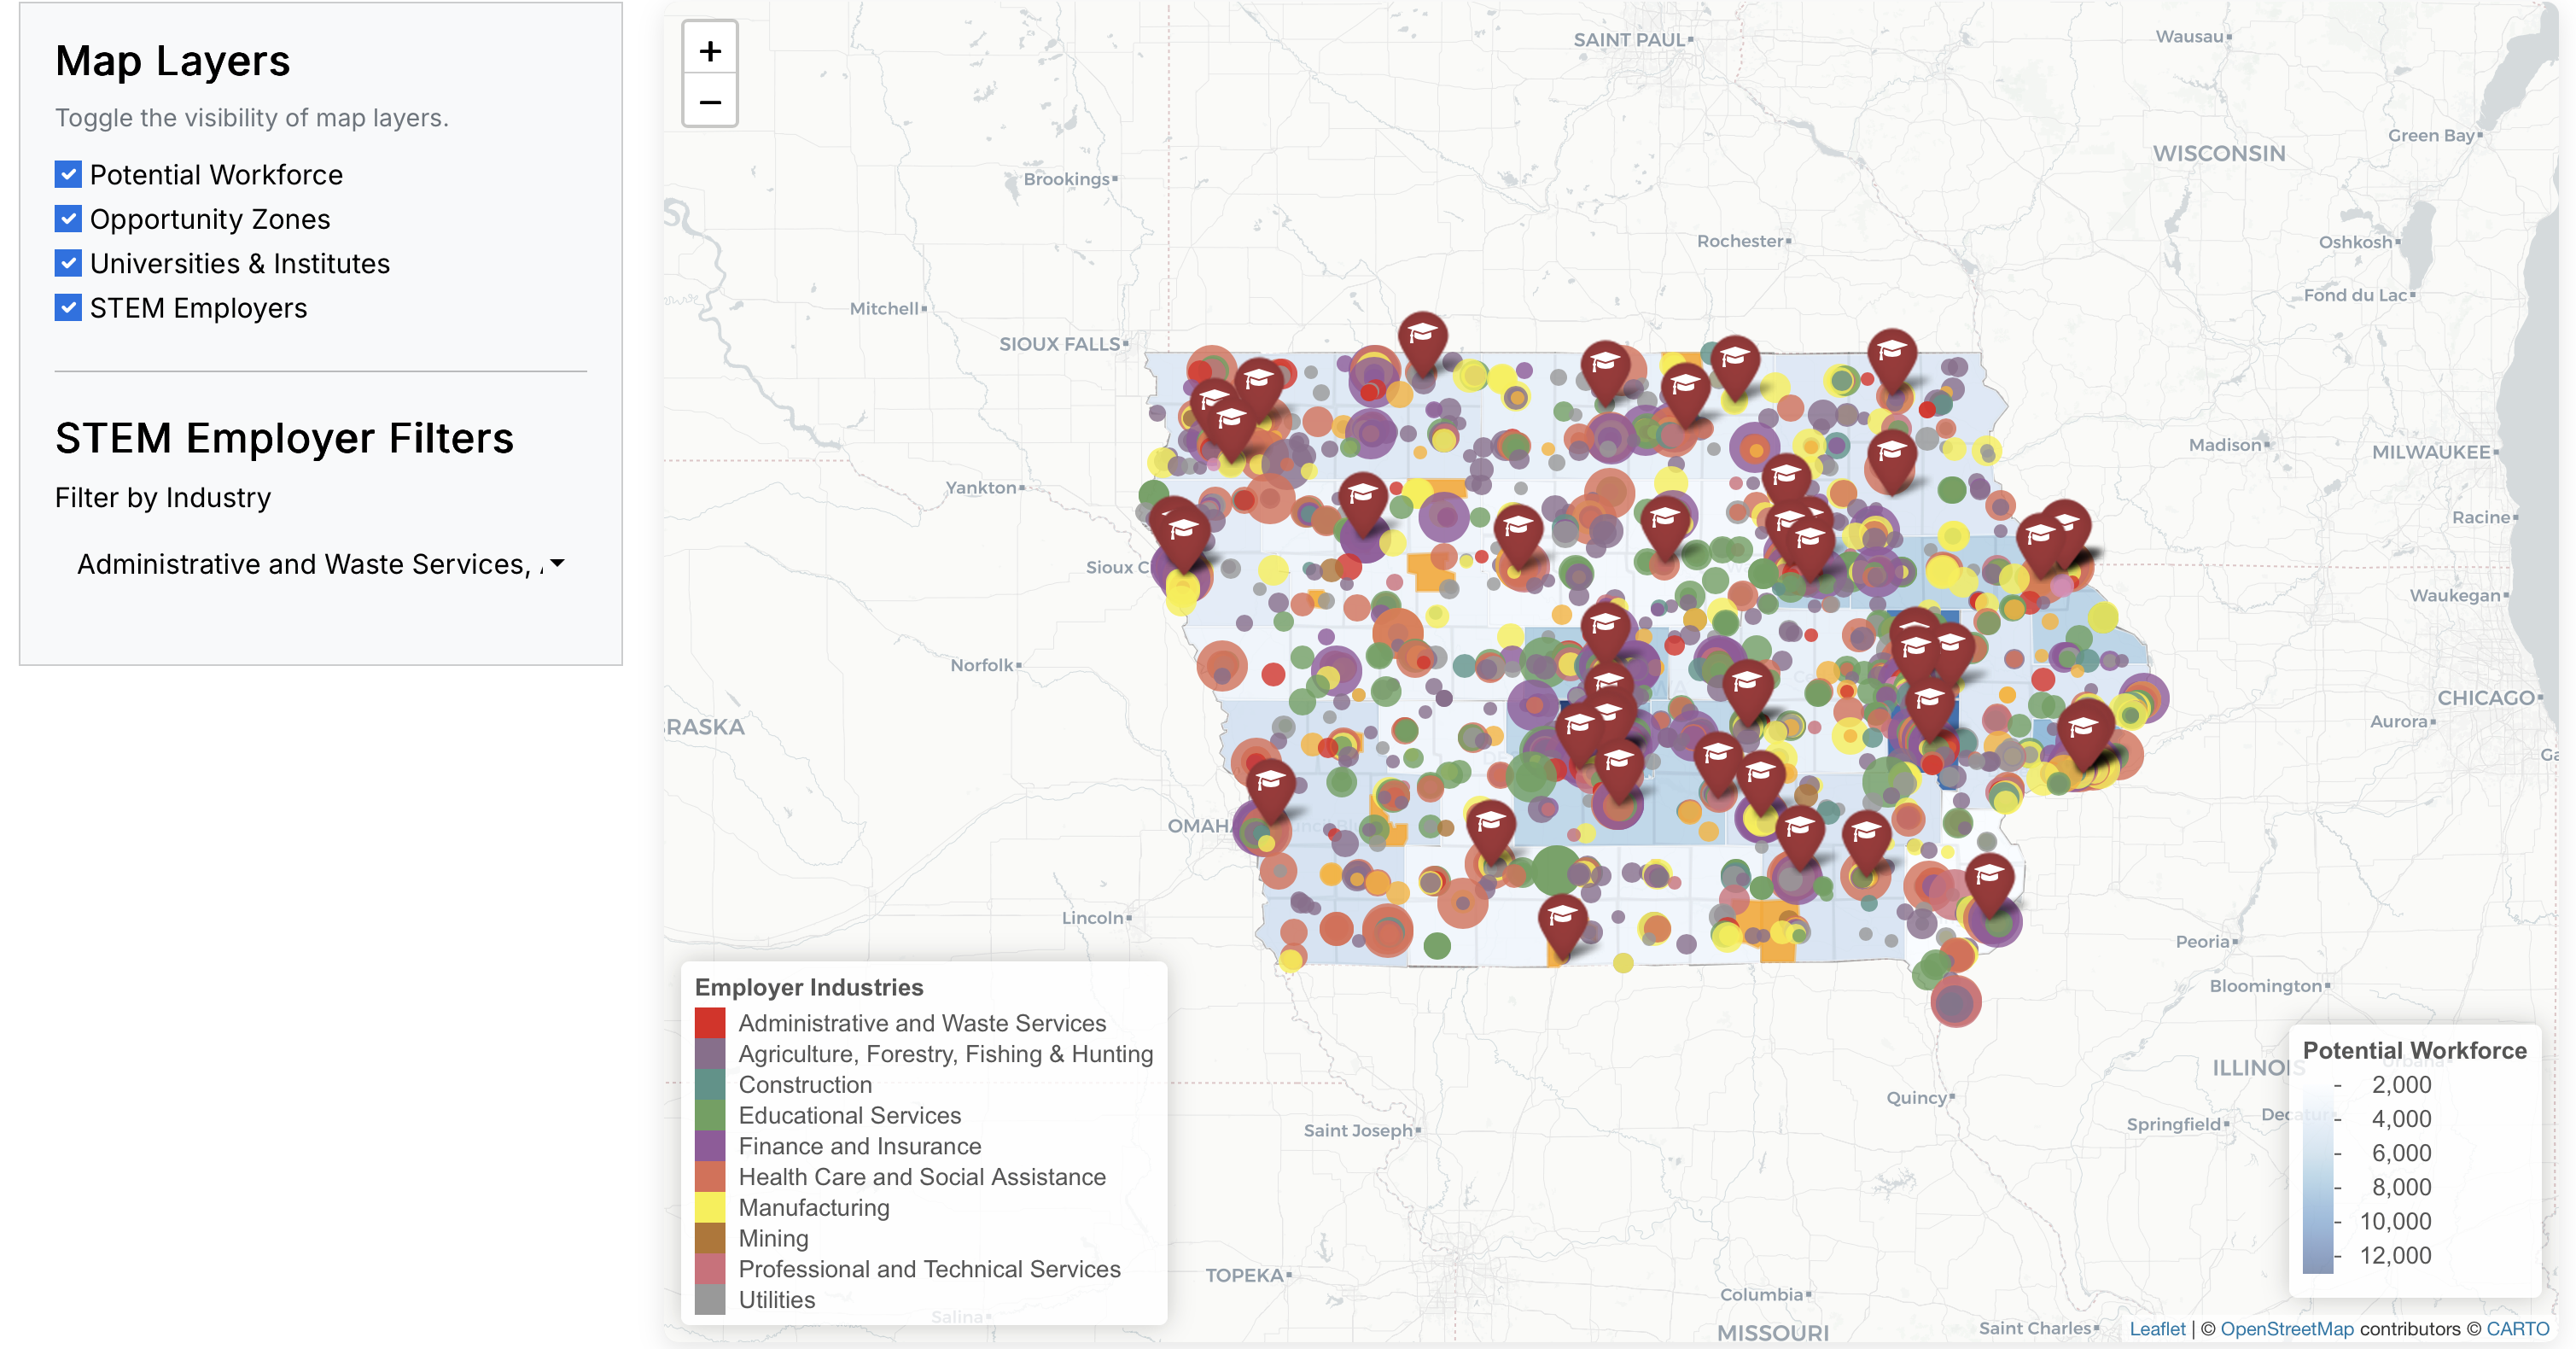
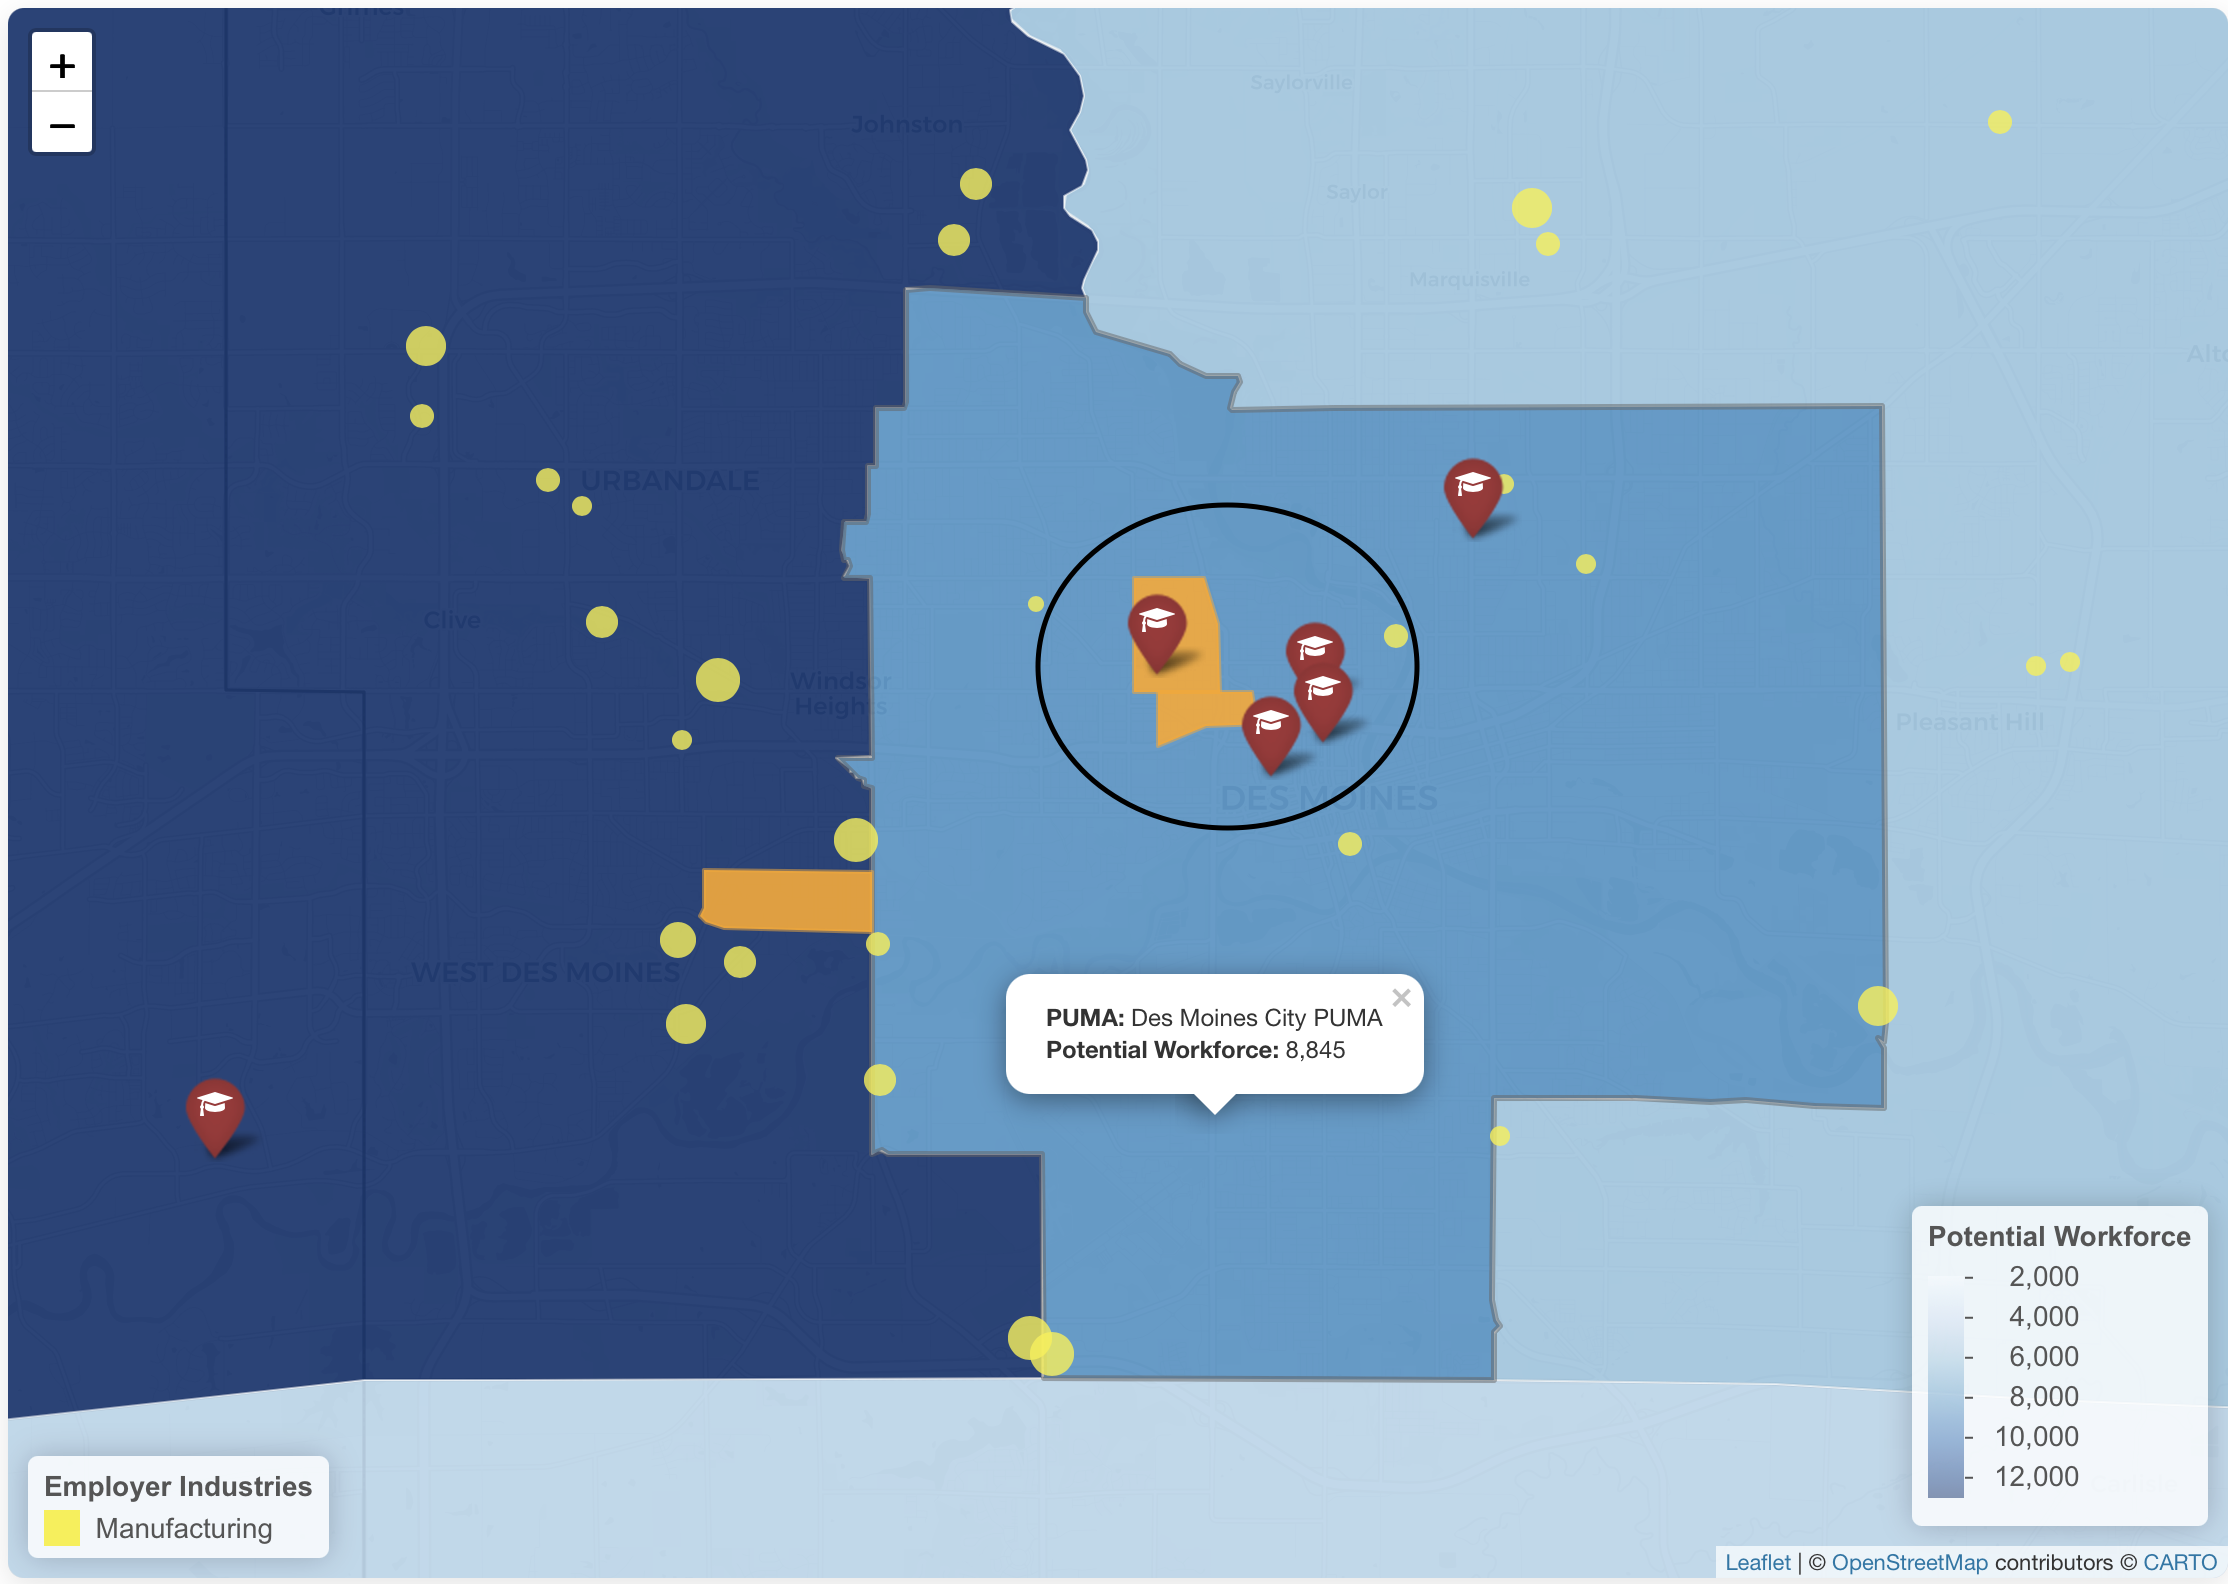
Example
This area represents a strong candidate for investment: it falls within an Opportunity Zone, only hosts a few small-scale manufacturing companies, has a nearby potential workforce of around 9,000 people, and is surrounded by 5 universities within a 5-mile radius — making it an ideal location for a new manufacturing company to establish operations.
Potential Uses:
A company can use the resource map to identify the key factors it requires and then apply a facility location model to determine the optimal site for its operations.
The map can also support strategic collaboration between companies and educational institutions to ensure workforce training aligns with industry needs.
STEM Datasource
Education
The Iowa Department of Education makes available several independent datasets and data collections about the schools, ranging from proficiency in math to budget allocation. They also provide a form to ask for custom data. We decided to design and implement a database where all the information is centralized and connected through the school or district codes, making it easier to group and analyze data. The following diagram shows a high-level view of our education database.
Catalog tables: Information that barely or does not change:
- SCHOOL-DISTRICT
- AREA-EDUCATION-AGENCIES
- CATEGORY
- SUB-CATEGORY
- SUBJECT
- EDUCATIONAL-MEASURES
Detail tables: Information that connects the catalogs, and information related to those catalogs. For example, PROFILE maintains information from the school, the educational measures, the subjects and categories, and their specific percentages, per year.All the tables that are not catalogs are detail-tables.

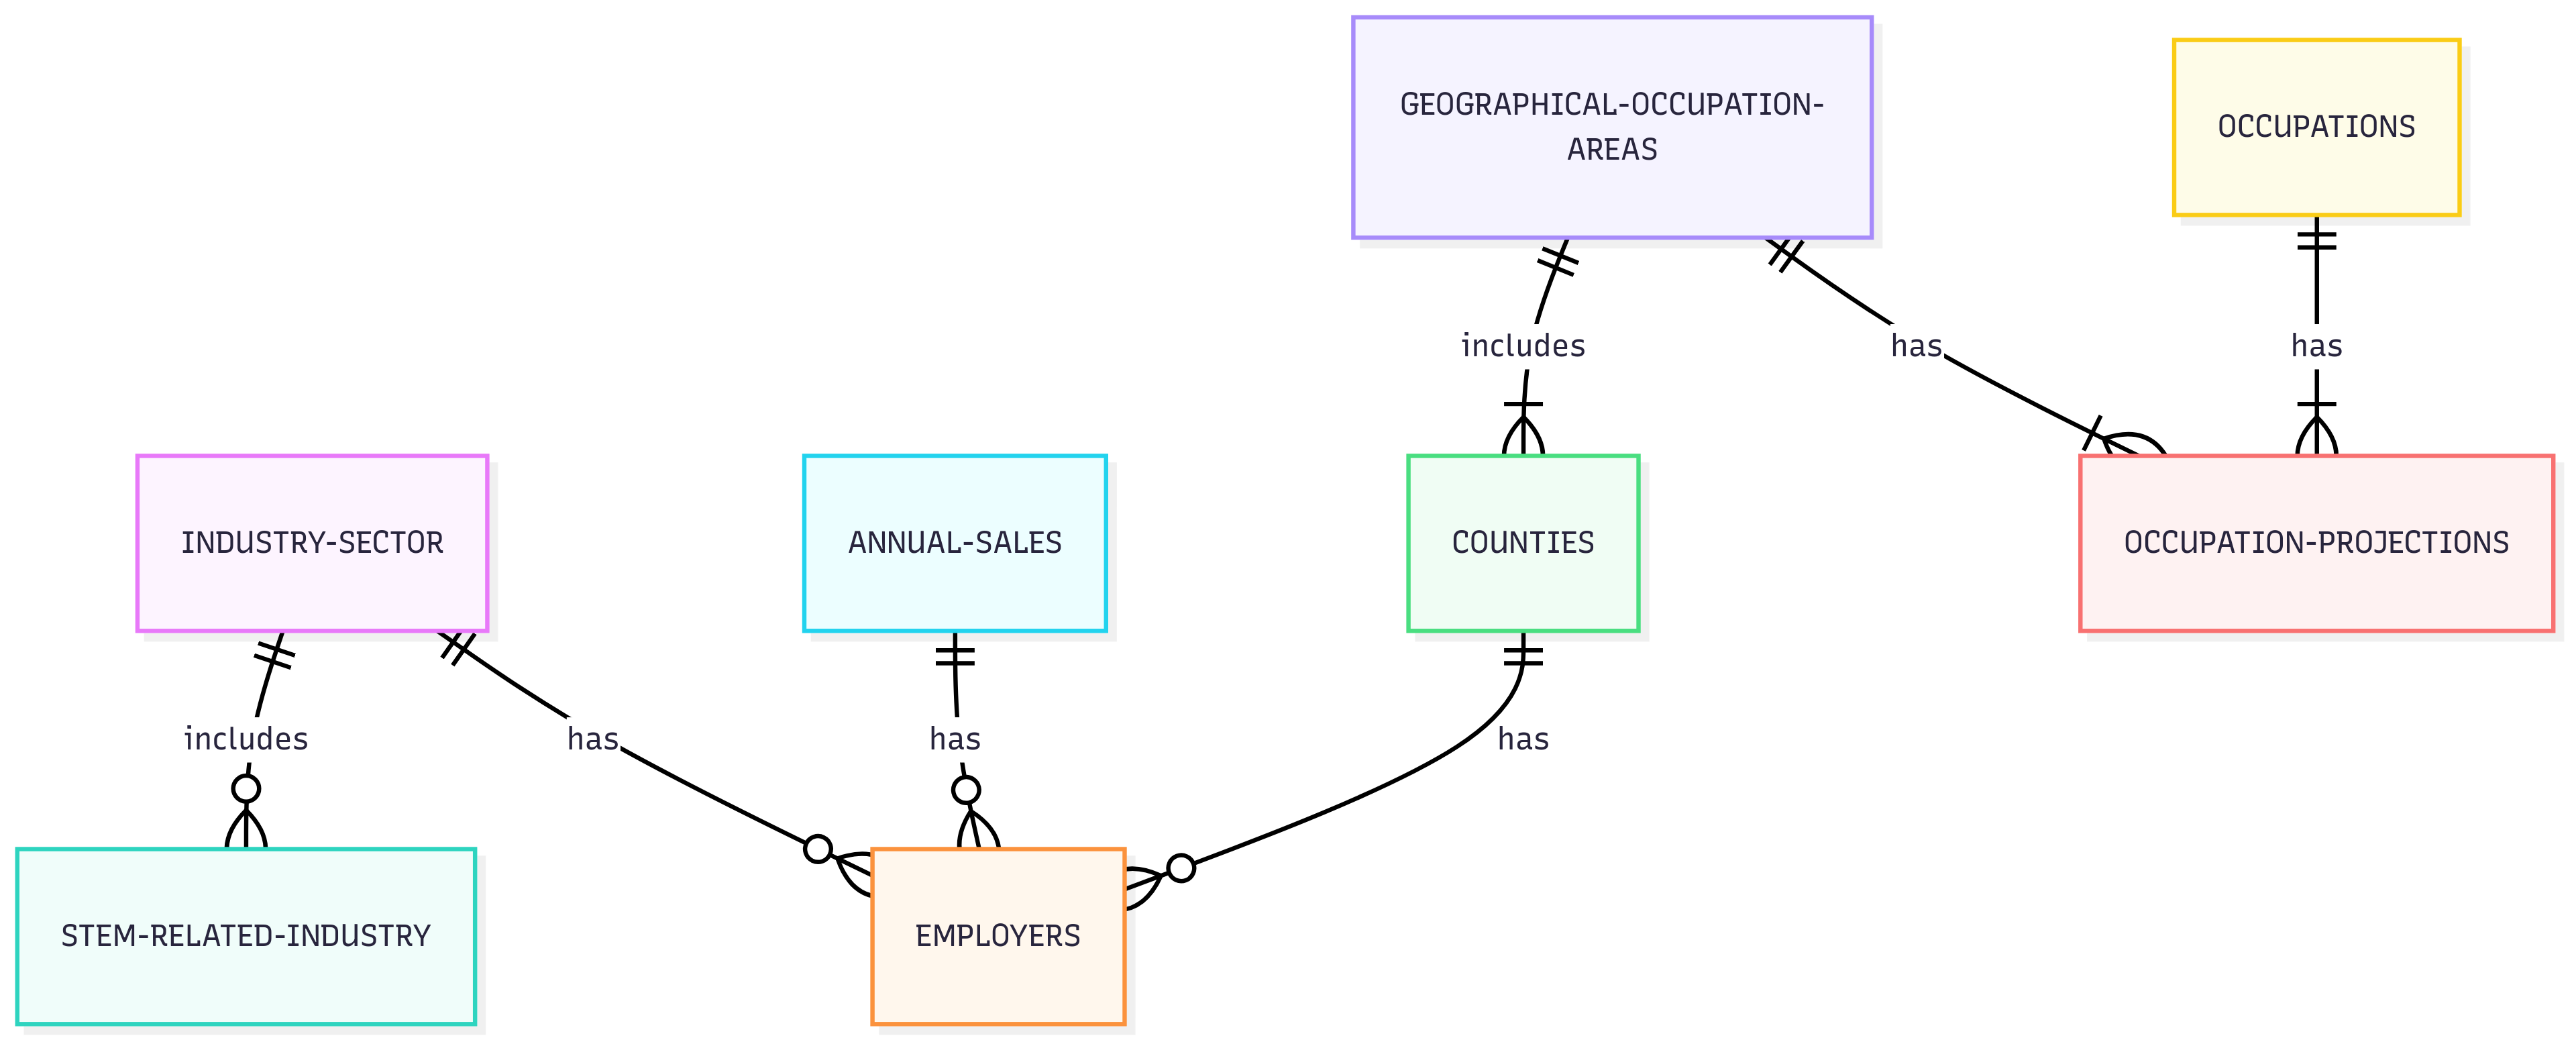
Industry
The Iowa Workforce Development maintains a map with employers’ information per industry and size class (1 to 4 workers, 5 to 10, etc.) They also provide occupation growth projections for 2022-2032 per area. Although there is no match between OCC and NAICS codes, we can match employers with each growth occupation area geographically.
Conclusions
The influence diagram shows three significant factors influencing a student’s decision to pursue a STEM career: academic achievement, family, and school. Some factors we analyzed were the ratio of students/teachers (at school district level), which is higher for metropolitan areas, or the students’ interest in math and science, which has decreased over the years. That is why initiatives like Scale-UP, BEST, and Teacher Externships are essential, as they aim to target students and teachers to engage them in STEM, which could increase K-12 interest, and therefore, the participants’ students’ mathematics and science performance.
Our STEM analysis suggests a disparity between K-12 education and the workforce and higher education situation. The interest in STEM has been declining over the years, and the same situation happens with the number of students proficient in math and science. In contrast, the STEM occupation projections 2022 2032 show an annual growth of 1.5%, superior to the average 0.6% and the 0.5% for non-STEM. If these trends continue, STEM-related industries could be forced to move outside Iowa to satisfy their workforce needs. Consequently, Iowa, the field of opportunities, could also experience higher levels of migration from those STEM professionals who will not be able to find those opportunities here.
Limitations and Future Work
We could not evaluate the impact of STEM initiatives at school levels because some programs target a small set of students. Instead, tracking the participant students’ performance in mathematics and science throughout the year could be a better approach to evaluate the initiatives.
Due to time limitations, we did not request access to the EdInsight, Iowa’s Department of Education Data Warehouse , which could provide updated information from different perspectives. A partnership between Iowa State University and Iowa’s Department of Education could provide access to such valuable information to provide more grounded conclusions that help STEM engagement and promotion.
Not all schools are shown on the ACT map since it is not mandatory to take the ACT
There are various additional factors that may influence a school’s STEM performance. While these factors are available in the database, time constraints prevented us from analyzing them in this study. A future direction would be to investigate these variables to identify potential correlations and determine which factors have the greatest impact on STEM performance. This analysis could also be at a grade level deeper insights.
References
Amalina, I. K., Vidákovich, T., & Karimova, K. (2025). Factors influencing student interest in STEM careers: motivational, cognitive, and socioeconomic status. Humanities and Social Sciences Communications, 12(1), 1-15.
Iowa Workforce Development. (n.d.) Occupational Projections. Retrieved from: https://workforce.iowa.gov/labor-market-information/occupations/occupational-projections
Science is US. (April,2025) Science at Work: The People and Industries Powering America’s Prosperity. Retrieved from: https://www.aaas.org/news/one-third-americans-work-stemm-jobs-accounting-39-gdp-according-economic-impact-study
Sellami, A., El-Kassem, R. C., Al-Qassass, H. B., & Al-Rakeb, N. A. (2017). A path analysis of student interest in STEM, with specific reference to Qatari students. EURASIA Journal of Mathematics, Science and Technology Education, 13(9), 6045-6067.
University of Kansas (August, 2024) Science and Engineering Degrees as a Percentage of Higher Education Degrees Conferred, by State, 2017-2022. Retrieved from: https://ksdata.ku.edu/ksdata/ksah/education/6ed14.pdf
U.S. Department of Education, National Center for Education Statistics, Integrated Postsecondary Education Data System (IPEDS) (September, 2022). Number and percentage distribution of science, technology, engineering, and mathematics (STEM) degrees/certificates conferred by postsecondary institutions, by race/ ethnicity, level of degree/certificate, and sex of student: Academic years 2011-12 through 2020-21. Retrieved from: https://nces.ed.gov/ipeds/Search?query=STEM&query2=STEM&resultType=all&page=1&sortBy=date_desc&overlayDigestTableId=202325
Wang, X. (2012). Modeling Student Choice of STEM Fields of Study: Testing a Conceptual Framework of Motivation, High School Learning, and Postsecondary Context of Support. WISCAPE Working Paper. Wisconsin Center for the Advancement of Postsecondary Education (NJ1).
Welch, C., Dunbar, S., Fina., A. (2023). Iowa Statewide Assesment of Student Progress. Iowa Testing Programs. Retrieved from: https://iowa.pearsonaccess.com/resources/research/ISASP_ACT_Validity%20Evidence.pdf