Poverty, Vehicle Access, and Unemployment in Polk and Linn County, IA
Overview
This census report examines various socioeconomic factors for census tracts within Polk and Linn County, Iowa. Through the use of scatterplots, static maps, and interactive maps, we can explore correlations between variables and better understand local challenges. This report utilizes the American Community Survey (ACS) 2021 5-Year Estimates, with a focus on analyzing:
- “B17001_002” : Population below the poverty line
- “B08201_002” : Households without access to a vehicle
- “B23025_005” : Unemployment rates
Poverty by Census Tract
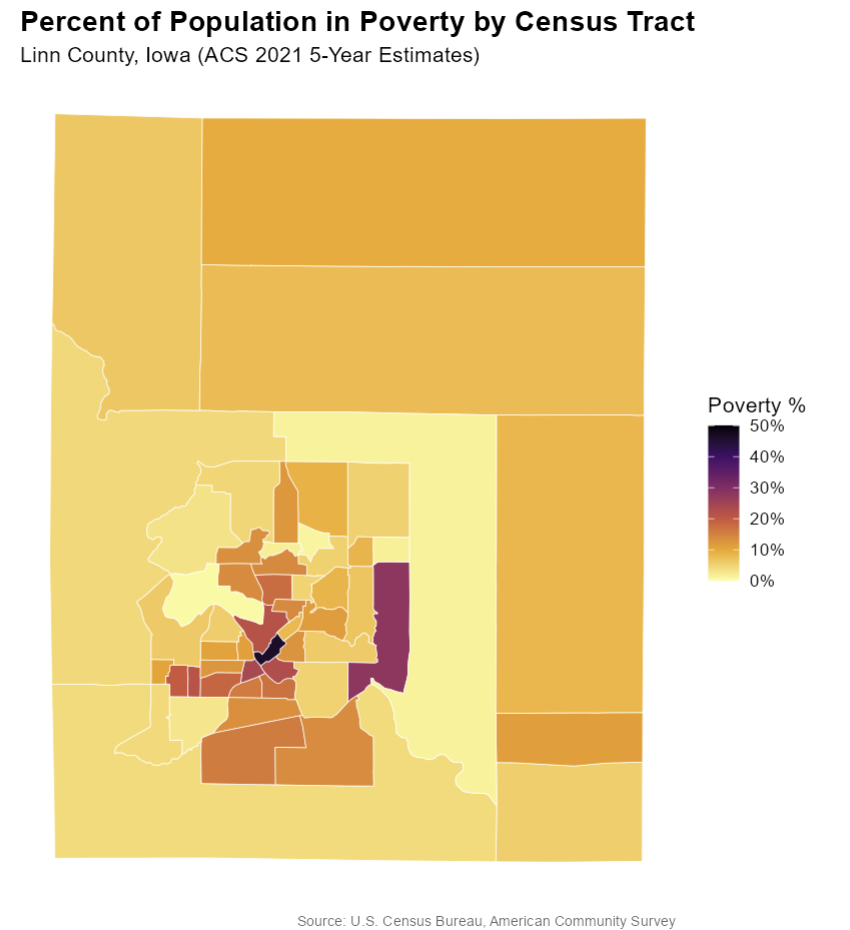
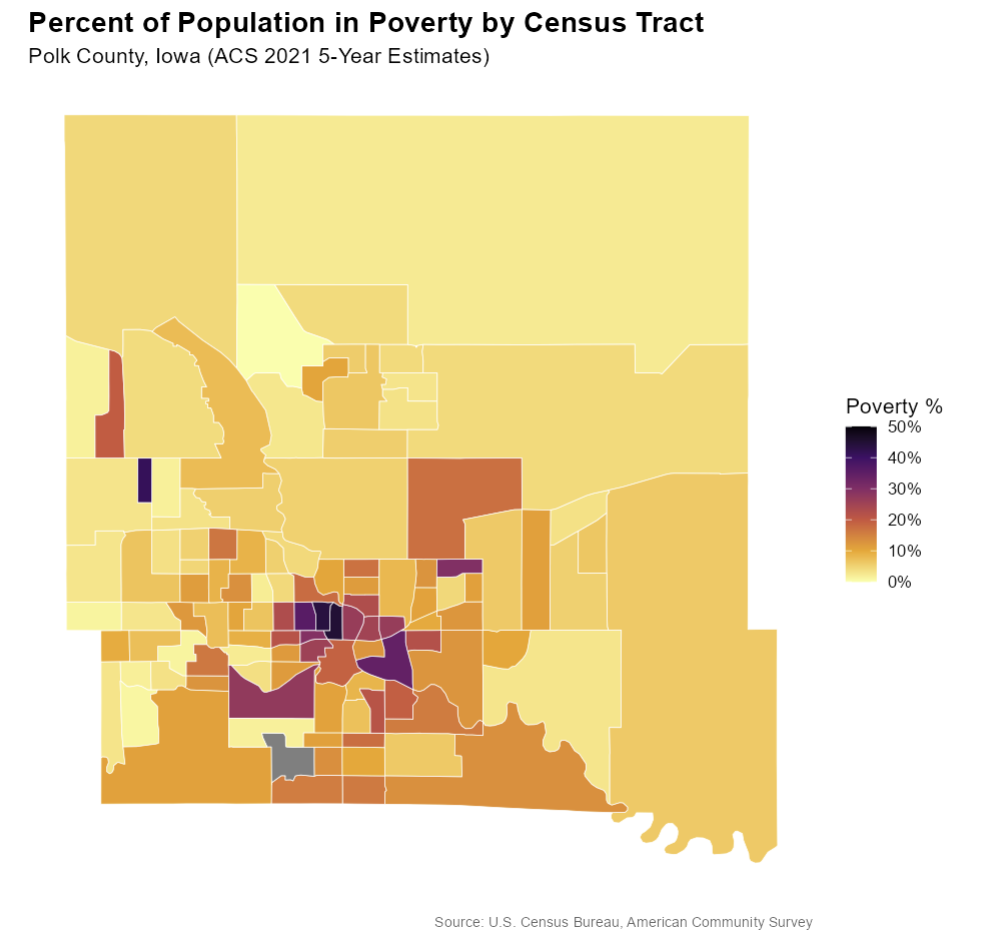
The poverty maps above show percentage of the population in poverty across census tracts in Polk and Linn counties. The maps reveal a clear concentration of poverty in relation to the urban cores of Cedar Rapids and Des Moines. Yet, Des Moines’ distribution of high poverty areas is a little more dispersed across the metropolitan area than Cedar Rapids. The gray tract in the Polk County map represents an airport tract with a population of zero.
Poverty and Vehicle Access
Linn County
Polk County
The interactive poverty and vehicle access maps above show poverty percentages by census tract, with green circles sized according to the number of households without vehicle access, revealing relationships between the two. Both maps show strong overlaps of high poverty and low vehicle access. Low vehicle access in Polk County is much more dispersed than in Linn County, with large dots reaching much farther than just the tracts near Des Moines’ urban core. By tapping on a tract or green dot, a pop up appears with the percent of people in poverty or the number of households without a vehicle in the corresponding tract.
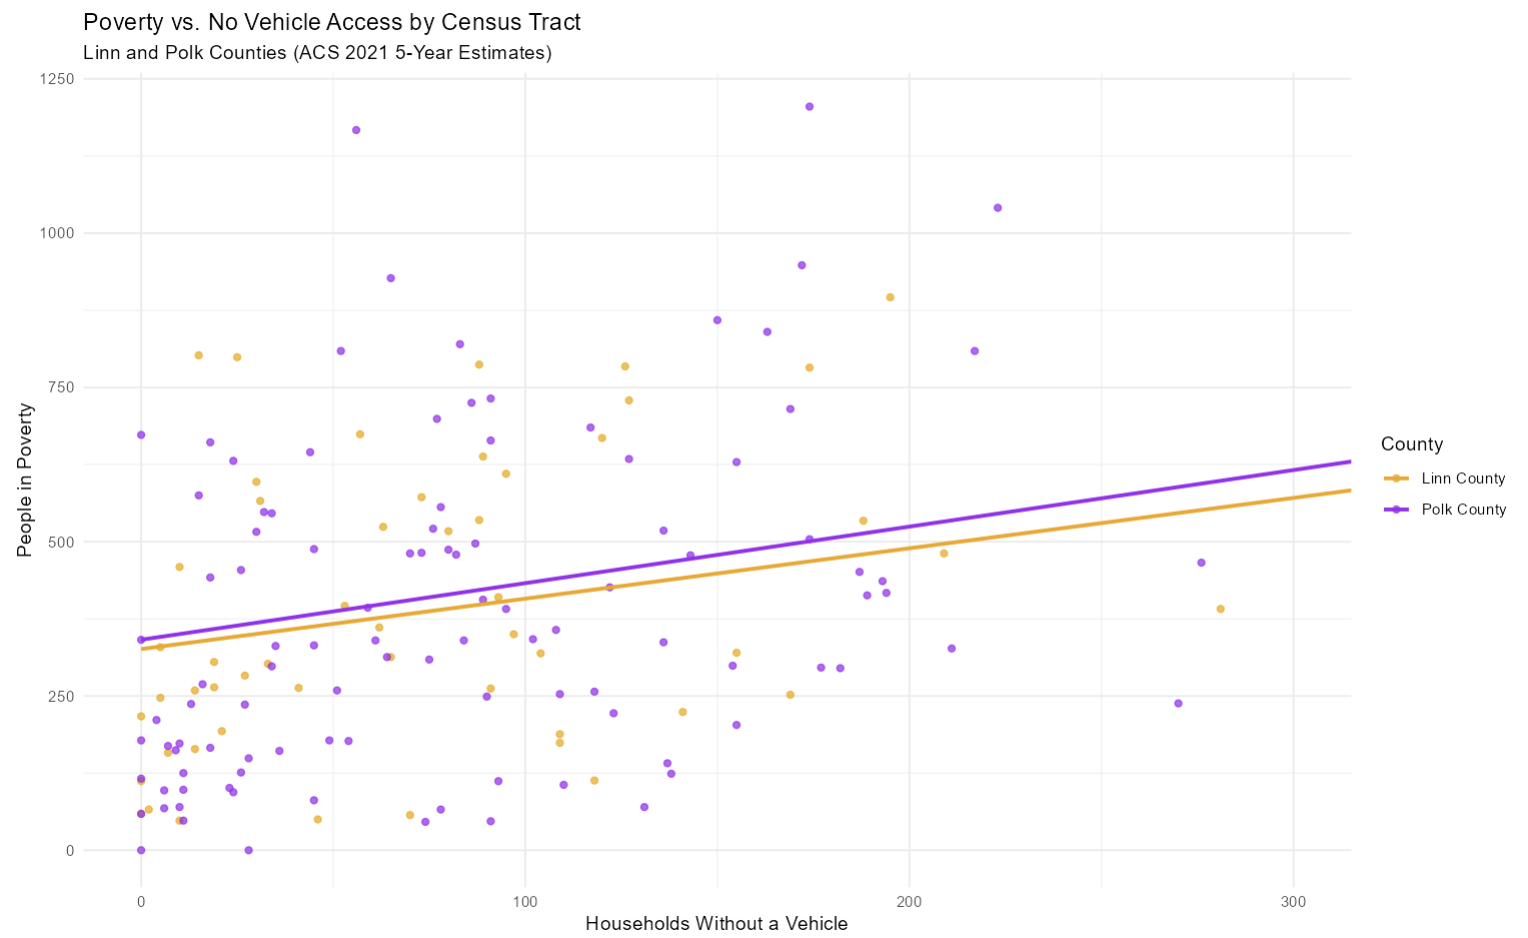
The scatterplot above shows households without a vehicle on the x-axis and people in poverty on the y-axis to explore correlations between the two variables. Each dot represents a single census tract. The purple line and dots represent Polk County and the orange line and dots represent Linn County. The trend line indicates a positive correlation in both counties, showing as the number of people in poverty increases, so does the amount of households without a vehicle.
Unemployment Rate by Census Tract
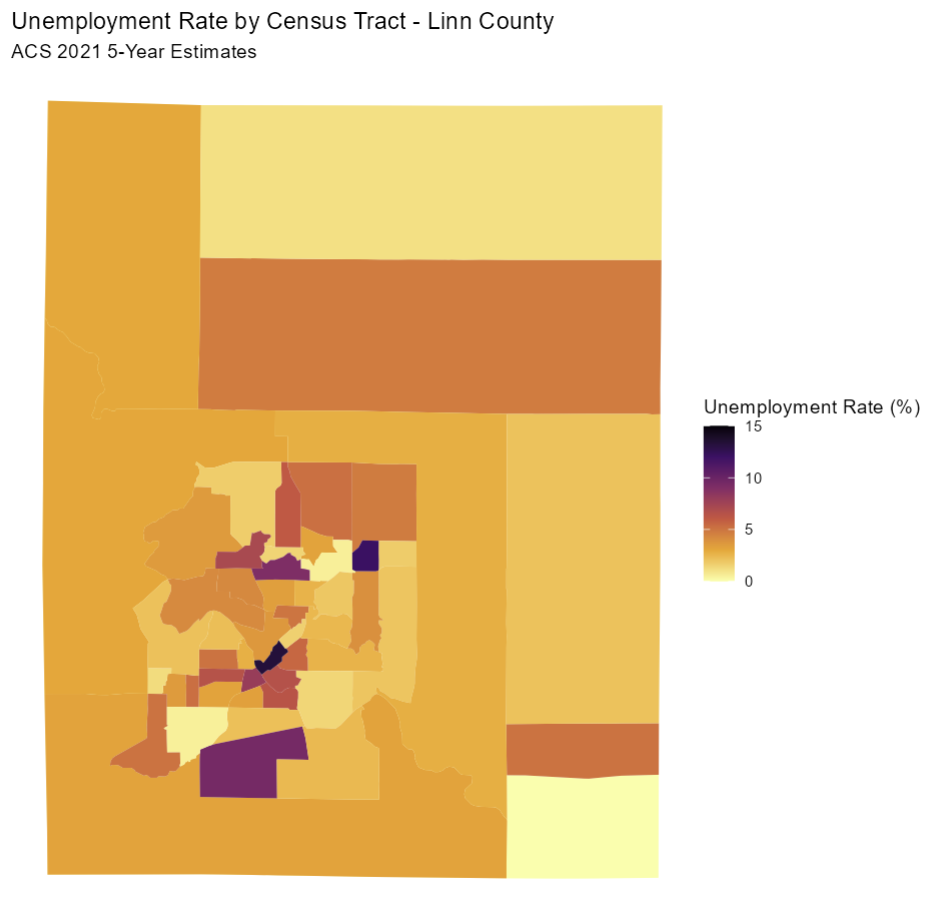
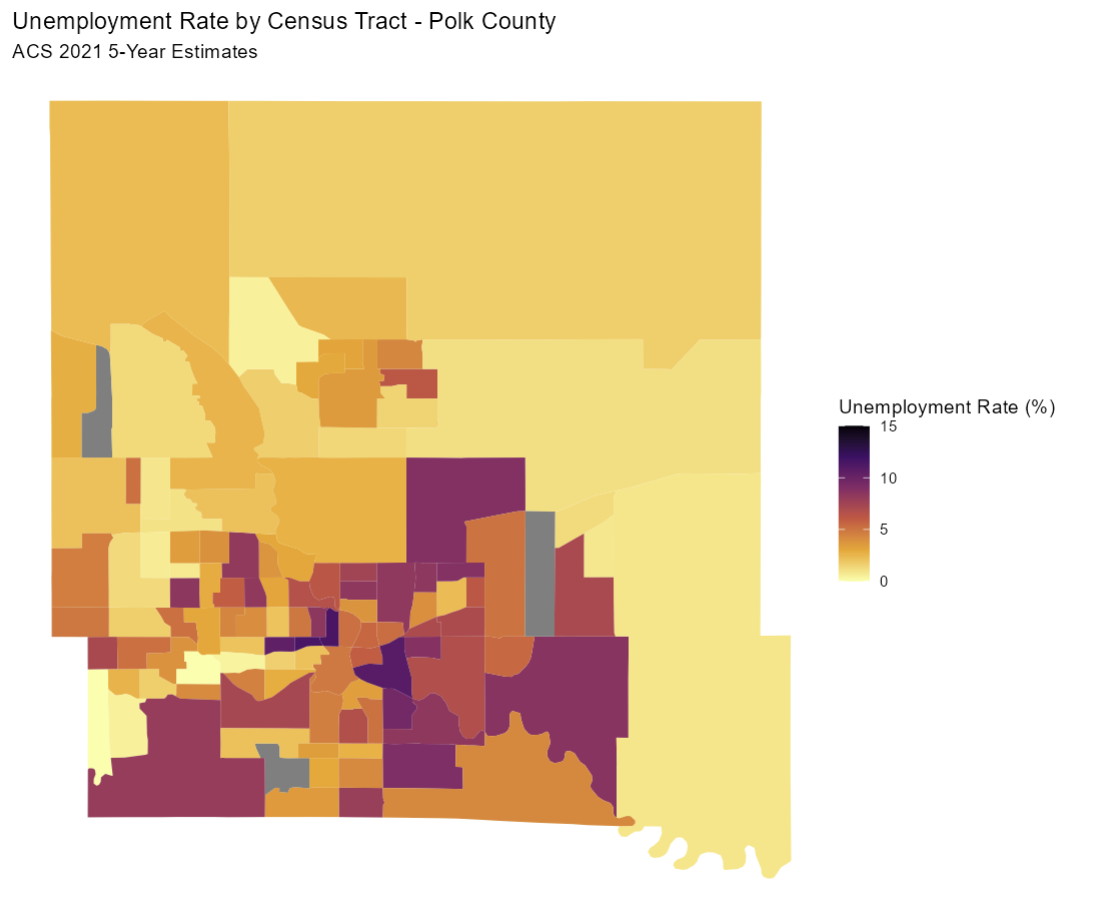
The unemployment maps above show percentage of unemployment across census tracts in Linn and Polk counties. The maps reveal a clear concentration of unemployment in tracts near and around the urban cores of Cedar Rapids and Des Moines. Polk County shows a much larger amount of tracts of high unemployment than Linn County. The bottom gray census tract in the Polk County map represents an airport tract with no data, the two other gray tracts had too high of unemployment to be shown in comparison with Linn County while keeping a plausible scale.
Unemployment and Poverty
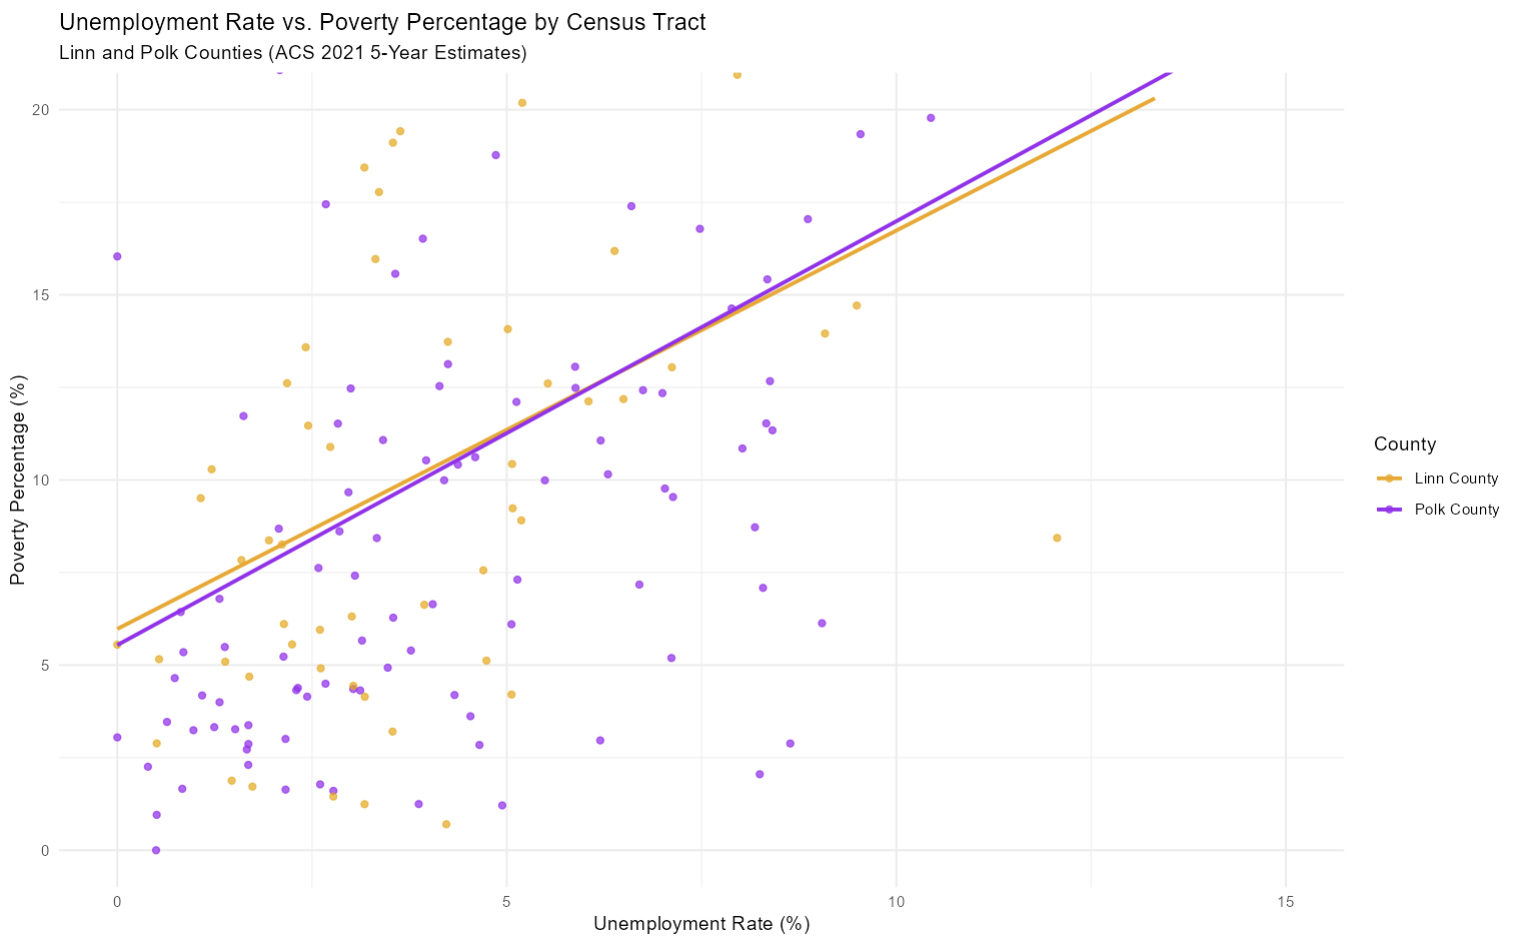
The scatterplot above shows unemployment on the x-axis and poverty on the y-axis to explore correlations between the two variables. Each dot represents a single census tract. The purple line and dots represent Polk County and the orange line and dots represent Linn County. The trend line indicates a positive correlation in both counties, showing as poverty increases, so does unemployment and vice versa.