Jorge’s Census Report
STEM degrees situation in Iowa
First, I wanted to understand the situation of STEM degrees vs. non-STEM degrees obtained nationwide. I used the American Community Survey (ACS) 5-year period for 2023. I normalized the data across the states to allow compare them. The following map shows the percentages of STEM degrees (blue) and non-STEM degrees (red) per state. You can hover over the states to see the details.
What is the percentage of STEM degrees obtained in the US?
Insights:
- Washington and California are the only states where STEM degrees earned are higher than non-STEM degrees
- The southern states have the lowest STEM degree percentages
- Iowa has the 4th-lowest percentage nationwide
What is the degree trend in Iowa in the last 10 years?
Second, I wanted to analyze the Iowa STEM degrees trend. I query the 1-year ACS between 2013 and 2019, and 2021 to 2023. 2020 is not included in the ACS 1-year survey.
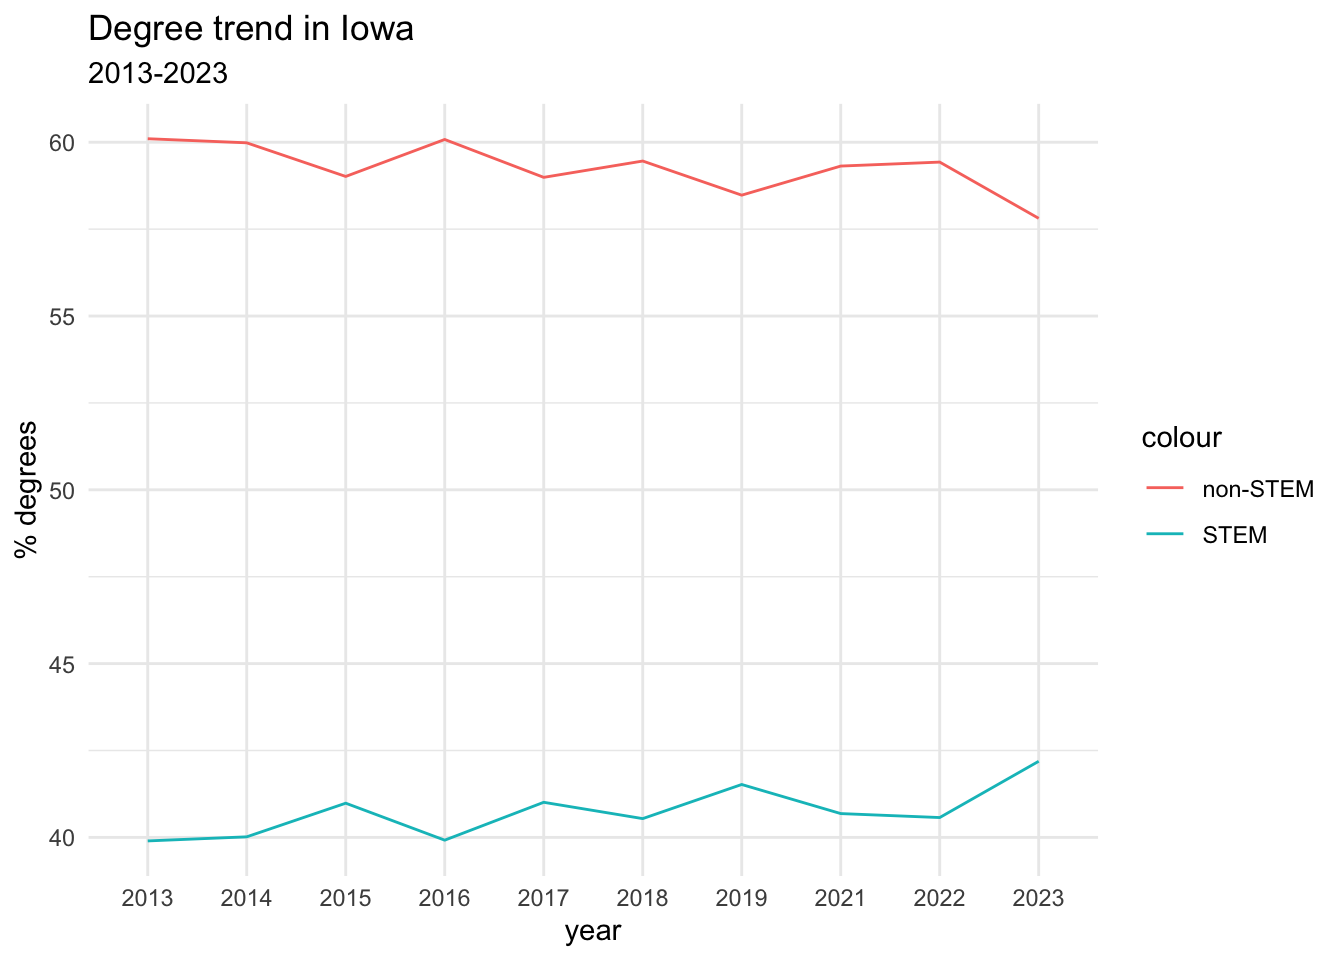
Both trends are very stable and have barely changed over the years. Notably, 2023 is the year with the lowest point for non-STEM degrees obtained and the highest for STEM degrees.