Introduction
“The Grey Pilgrim, that is what they used to call me. 300 hundred lives of men I’ve walked this Earth and now I have no time.” Gandalf the Gray, the Two Towers.
This week, we went deep into the analysis of our four-week findings. And then, new questions and potential directions appear, and we need more data sources, and the cycle repeats. The challenge is, like Gandalf, we are running out of time: five weeks passed in just an eye blink, and the end of the project is around the corner.
Therefore, we focus our efforts on two key questions that can help us better understand the High Schools’ STEM situation in Iowa:
How are the high schools doing regarding mathematics and science proficiency (ISASP test)?
How are the high schools doing regarding the ACTs for mathematics and science?
We also wanted to understand the perspective of those students who don’t attend college and start working on a STEM-related job, and we proposed two additional questions:
What are the differences between age, gender, wages, race, and transportation mediums between people with a bachelor’s degree and those without a bachelor’s degree?
Are those differences the same for people working in non-STEM-related occupations?
Methodology
We used the education database we created in the past two weeks to extract the information corresponding to the ISASP proficiency and ACT scores, and the PUMS data from 2021 was used to analyze the perspective of people without a bachelor’s degree.
We used the classification proportioned by the Iowa STEM Council to define a school as public or rural.
Findings
Status of STEM Education in Iowa (by regions)
Previously, we examined the overall state of STEM education in Iowa. Now, we shift our focus to specific regions within the state to identify which areas are excelling and which are underperforming. To do this, we analyzed a range of variables from the ISSP, including:
- Math and Science scores (ISASP) for Elementary, Middle and High school
- Number of Schools Transitioning From a Average or above Position to Needing Help
- Average Number of Science and Math Courses Taken in High School.
Why these variables?
These variables are strong indicators to whether a region is performing well in terms of STEM education. By highlighting which areas are performing well, we can investigate the strategies and resources that contribute to their success and apply these practices to underperforming regions.
Our findings revealed that there isn’t a single region that consistently underperforms across all indicators. Instead, each region appears to face challenges in at least one area. This prompted us to rethink our approach. Evaluating STEM performance at the regional level may be too broad; instead, shifting our focus to individual schools may provide more insightful results. By identifying clusters of high-performing and low-performing schools, we can better understand the factors contributing to success or struggle — bringing us closer to our goal of improving STEM education across the state.
We chose to focus our analysis on the STEM status of high schools, as these students represent Iowa’s upcoming STEM workforce. To identify potential clusters of high and low performing schools, we evaluated four indicators: * Math Proficiency * Science Proficiency * Math ACT * Science ACT
Limitations
- Not all schools report ACT scores
- Worked with number of students proficient rather than the scores (no data on scores itself)
- Some schools’ addresses didn’t show up on the geocoder
Perspective of STEM workers with a HS diploma
Goal
To better understand the relationship between higher education and employment outcomes, we analyzed individuals with and without a Bachelor’s degree in STEM fields across five key dimensions. We then compared the same factors for those with and without Bachelor’s degrees in non-STEM fields, to examine whether these trends are unique to STEM or more broadly associated with having a degree in general.
- All data for this analysis comes from the 2021 PUMS (Public Use Microdata Sample) 5-Year Estimates by the U.S. Census Bureau, focusing specifically on Iowa-born individuals.
Why These Variables?
We selected the following factors to compare across both groups:
- Wages – A direct indicator of economic return.
- Gender – To observe equity and disparities.
- Age – For workforce entry and progression trends.
- Mode of Transport – A proxy for accessibility and lifestyle.
- Race – To explore diversity and representation.
1. Wages
Do degrees — especially in STEM — lead to better earnings?
We examined average wage distribution for those with and without a Bachelor’s degree in both STEM and non-STEM categories.
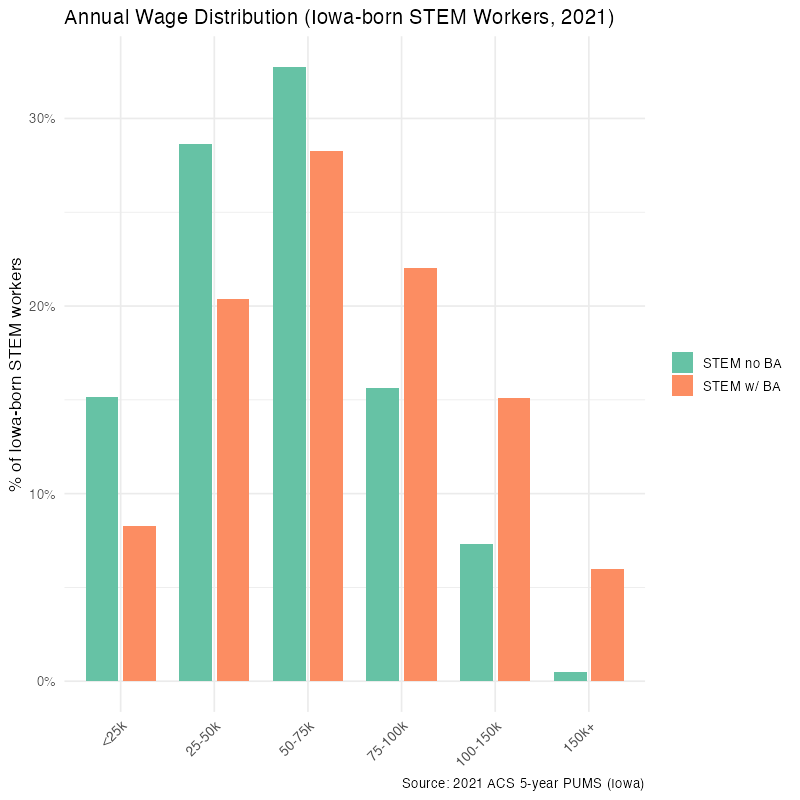
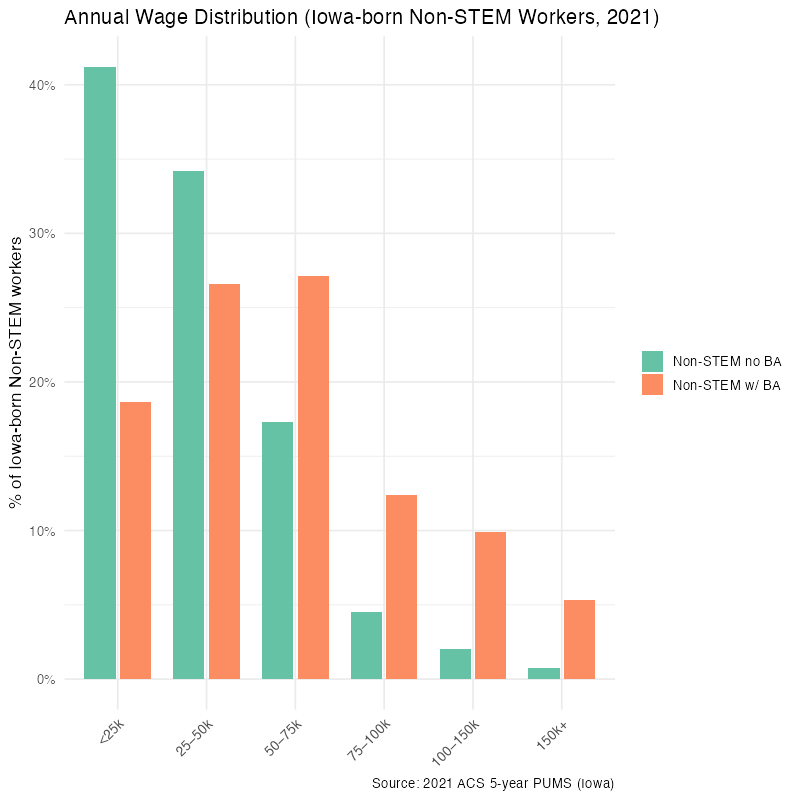
Observations
- Higher wages are more common in STEM
- A much larger percentage of STEM workers with a Bachelor’s earn in the $75K–150K range compared to non-STEM.
- From $25K–100K we see that STEM workers without a Bachelor’s earn more than Non_STEM with a bachelors.
- Higher education boosts wages in both STEM and non-STEM fields, though livable incomes are still possible without a bachelor’s degree, especially in STEM.
2. Gender
How does gender representation differ by degree type and field?
We explored how male and female representation changes based on education, and whether gender gaps persist or improve in STEM versus non-STEM.
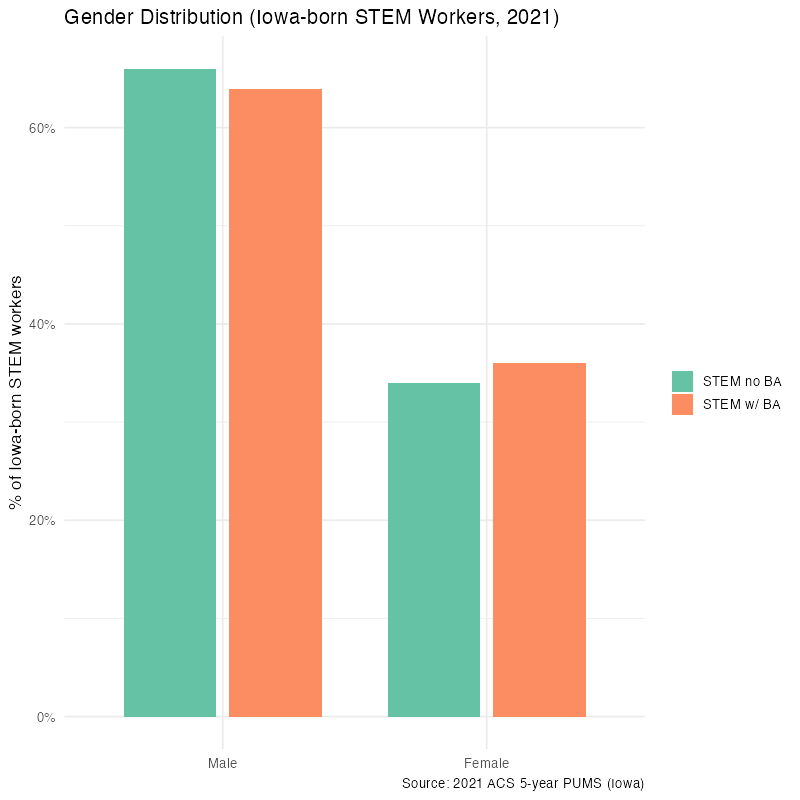
Observations
- Males are dominant in STEM regardless of education
- Over 65% of STEM workers (with or without a Bachelor’s) are male.
- Female representation in STEM remains below 35% even with a Bachelor’s degree.
- This suggests that gender gaps in STEM persist even as education increases, likely due to long-standing cultural, social, or systemic barriers in STEM fields.
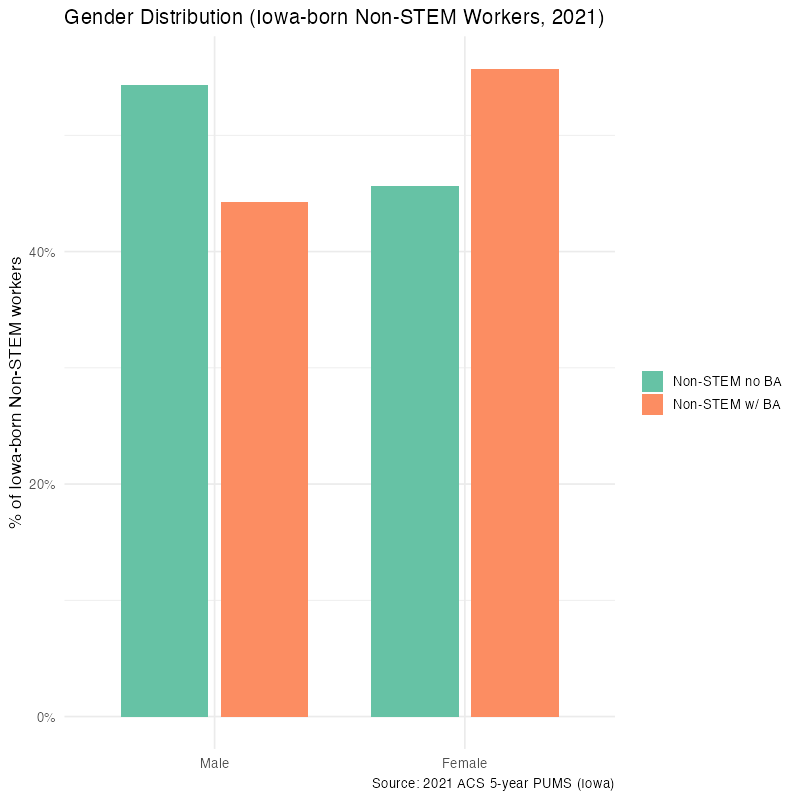
- Non-STEM Fields Are Female-Dominated With Degrees
- Among workers with a Bachelor’s, females actually outnumber males by a clear margin.
- This reflects that women are earning degrees in large numbers, but often in non-STEM disciplines.
- Among those without a Bachelor’s, males are still slightly more represented — perhaps due to male-dominated trades or manual labor roles that don’t require a degree.
3. Age
Are younger or older workers more likely to hold degrees in STEM or non-STEM?
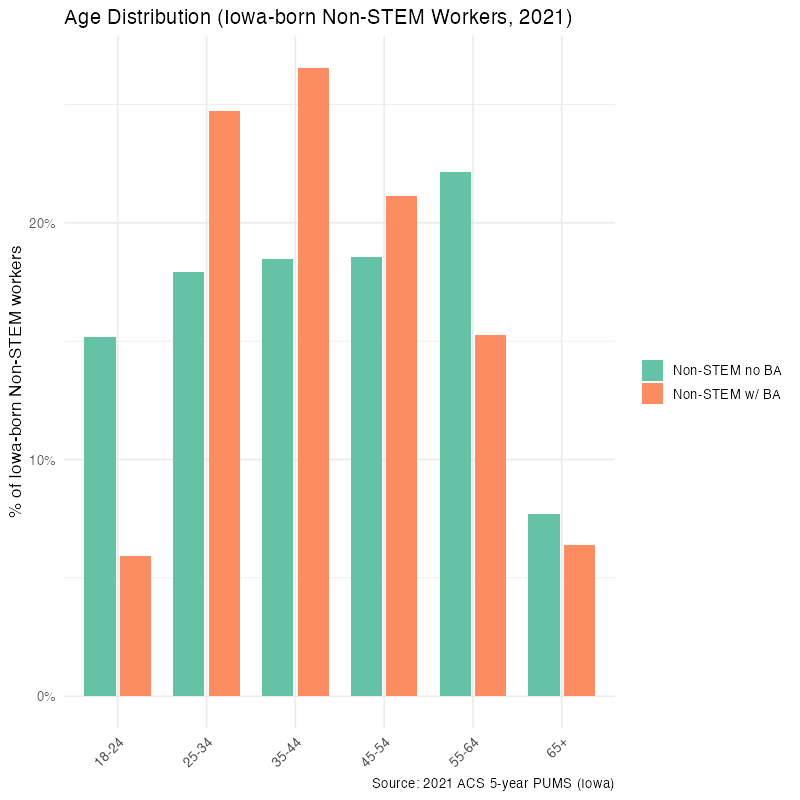
We broke down the age distribution of Iowa-born workers based on their degree and field of study.
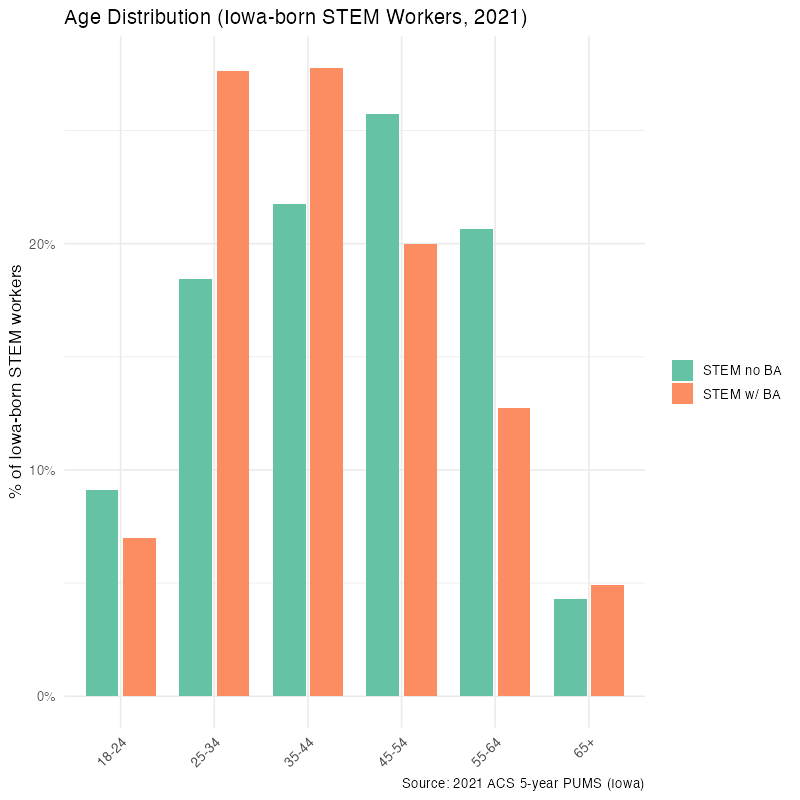
Observations
- Younger STEM Workers Are More Likely to Have a Bachelor’s Degree
- This shows that younger STEM professionals are increasingly degree-qualified, likely due to rising educational standards in tech and engineering careers.
- For older STEM workers (55+), degree vs no-degree numbers even out — possibly reflecting a time when STEM roles were more accessible without formal degrees.
- Sharp Drop in Non-STEM Bachelor’s Holders Under Age 25
- Suggests non-STEM college grads enter the workforce later, or take longer to find work in their field, or that more young workers skip degrees altogether in non-STEM roles.
- College Degrees More Normalized in STEM
- Across nearly every age group (except 65+), a larger share of STEM workers have Bachelors compared to non-STEM.
- It reinforces how STEM careers have increasingly formalized into degree-requiring pipelines, while non-STEM jobs remain more mixed in qualifications.
4. Mode of Transport
How does having a degree affect transportation choices?
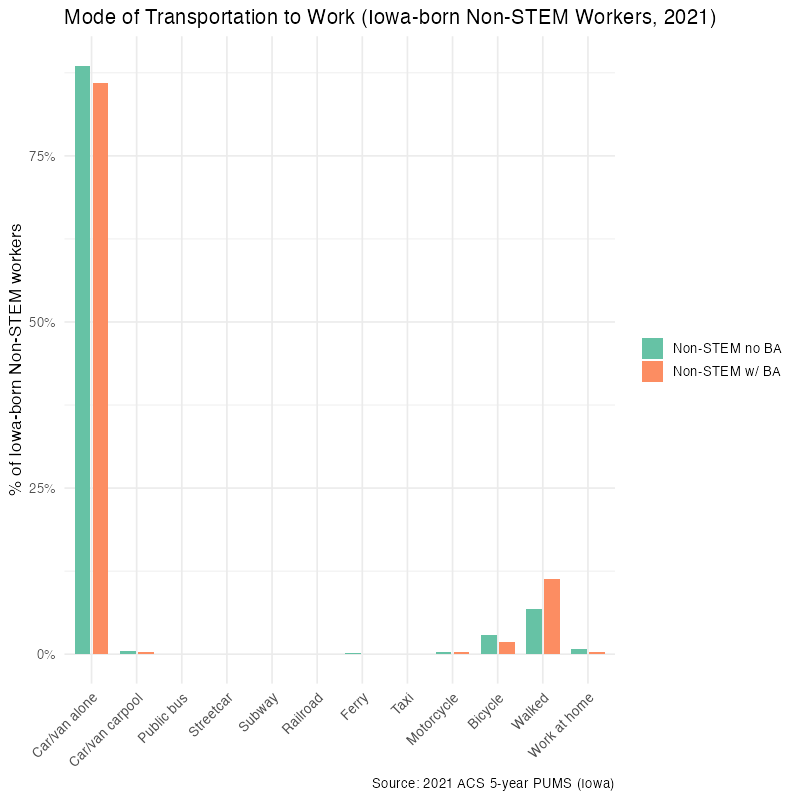
We visualized commuting methods for individuals with and without Bachelor’s degrees, comparing STEM vs non-STEM education paths.
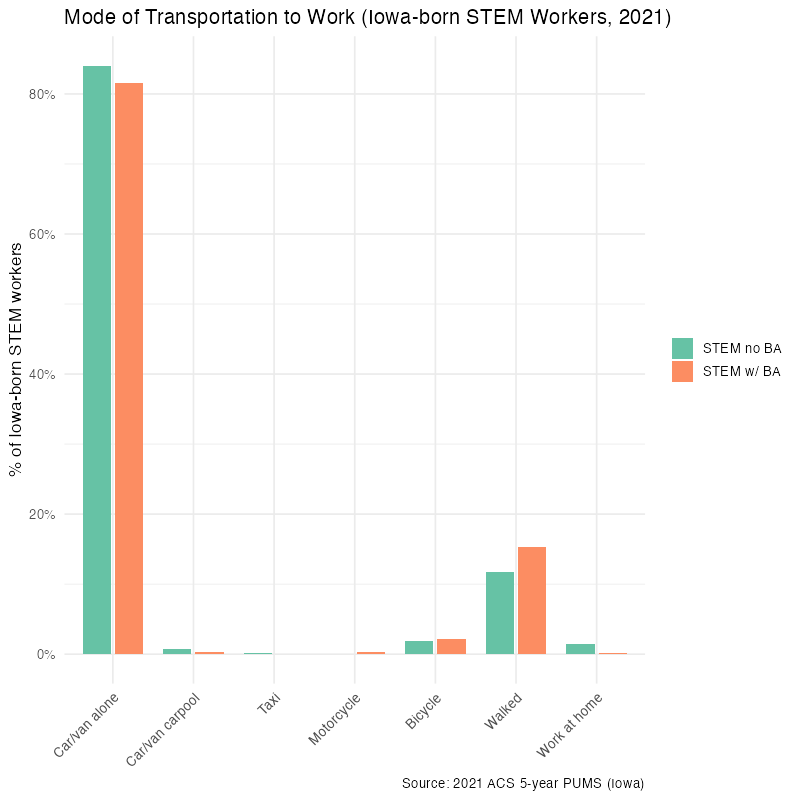
Observations
- Driving Alone Dominates All Groups
- Over 80% of all groups drive alone to work.
- This indicates limited public or alternative transport infrastructure in Iowa, regardless of education level or field.
- Walking to Work is More Common for Workers without a Bachelor’s
- Particularly high among non-STEM without a Bachelor’s nearly 15%, compared to under 10% for others.
- Suggests proximity-based jobs (like service or labor roles) are more common without a degree.
- Biking and Public Transit Usage Increases with a Bachelor’s (Very Slightly)
- Especially in STEM fields, workers with a Bachelor’s bike or walk slightly more.
- This may relate to urban-based tech/engineering jobs where biking is viable and culture promotes sustainability.
5. Race
How diverse are STEM and non-STEM degree holders?
We examined racial representation in Iowa across educational attainment and field of study.
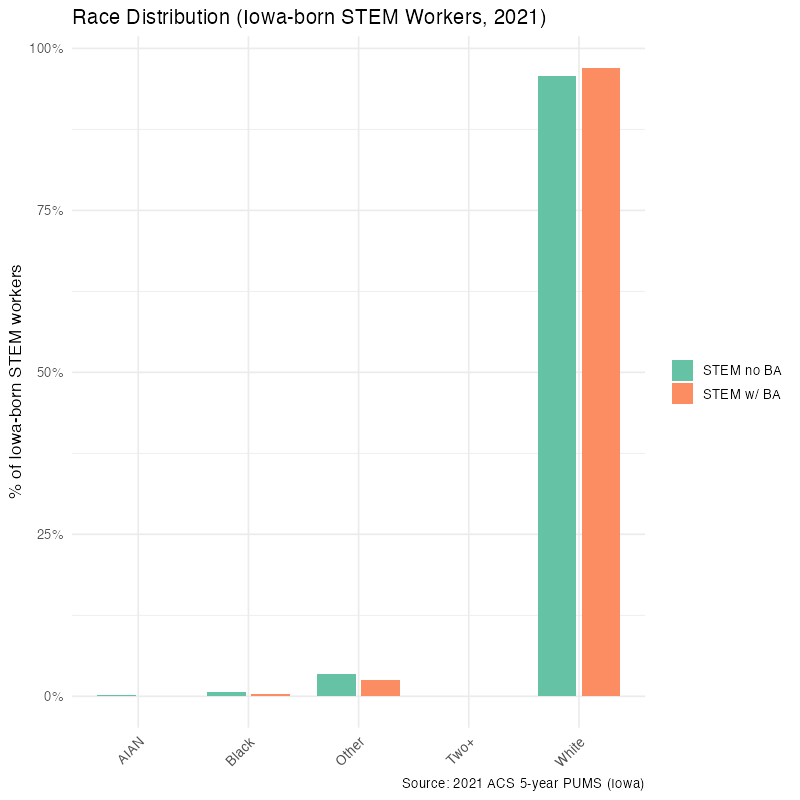
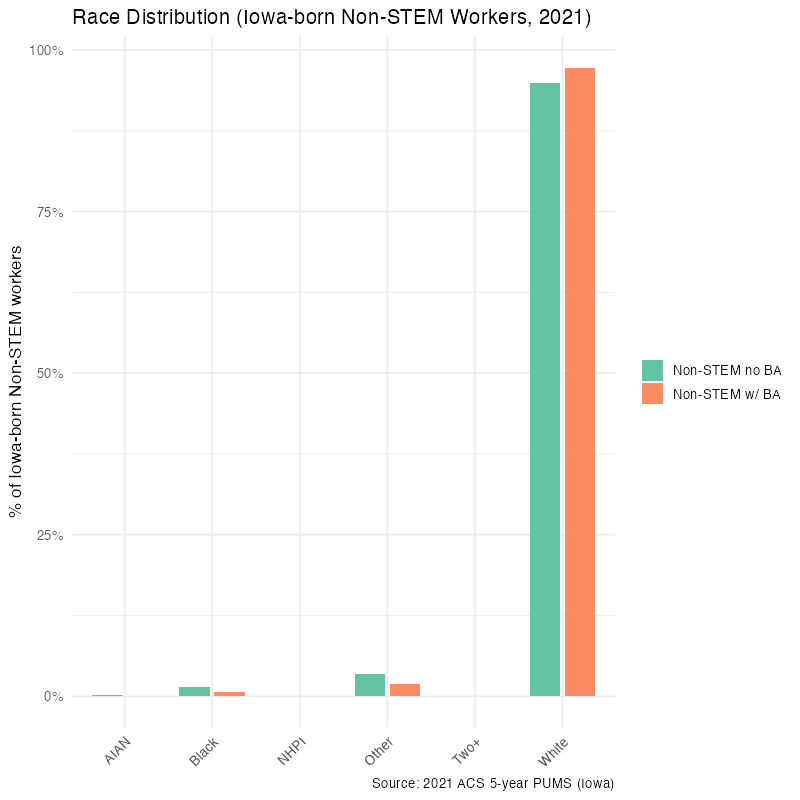
Observations
- General trends across both charts
- White workers dominate all categories, making up over 90% of Iowa-born workers across all education and field combinations.
- This is not surprising given Iowa’s overall demographic makeup, which is predominantly White.
- Earning a Bachelor’s seems to reduce racial diversity (particularly in STEM)
Conclusion
The data reveals how significantly Bachelor’s degrees — especially in STEM — shape life outcomes, from wages to transportation to representation:
- STEM fields—especially with a Bachelor’s, offer significantly higher wages, younger and more educated workforces, and slightly more sustainable commuting habits.
- Earning a Bachelor’s generally improves income and access to tech-oriented work, but doesn’t necessarily close gender or racial gaps—especially in STEM.
Limitations
- Focused only on Iowa-born individuals, not all residents.
- Data is from 2021 PUMS, and may not reflect post-pandemic shifts.
Next steps
Complete the resources map: We will manually classify each six-digit NAICS to identify STEM-related businesses.
Analysis of the best-performing high schools in mathematics and science proficiency. What are they or their school districts doing differently?
Analysis of STEM initiatives and their potential impact: BEST, Scale-Up.
Analysis of the migration flows for the STEM workforce who leave Iowa.
Document everything!